This is a standar way of answering by Amateur Technical Analysts and tends to confuse a lot of traders and investors.
Let us look why
Question – How does Reliance look on charts ?
Answer – Buy above 900 and sell below 850.
Question – What does the Index look like?
Answer – Nifty will fall below 4900 and give a breakout above 5100.
Now if i were to look at it from a third person or a novice into markets he would term the Analyst as the one who has an answer for everything 🙂 but is not clear about any direction.
Also with everyone now using fibonacci calculators , pivot tables, mathematical calculators, camarilla equations and what not the answer has become so simple – Buy Nifty above 4915 stoploss 4905 tgt 4930/4945/4960/4980 🙂 ( This and many other quick number game has created a bad name for genuine analysis )
Now what happens is there is no logic or trade setup for the above trade but its just a game of numbers and not Technical Analysis so it ends up in losing trades.
Classically Technical Analysts are supposed to be Trend Followers and to be on lookout for Major Trend Changes. Many times there are no Technical Trading Setup when its ok to have NO VIEW and No Trades. Also a Technical Analyst keeps looking for more data to substantiate his analysis and keeps evolving – like co-relations – India Vix, Commodities , Global Indices, Option Strategy , Derivatives, FOREX and more --- ( We keep posting on above for more in depth research ).
So beware of all the BUY ABOVE AND SELL BELOW Analysis 🙂 --- Look for reasons/analysis/data/facts to trade and not a gamble on numbers.
This is the reason we post a lot of Technical Charts with Detailed analysis instead of Buy/Sell Ideas 🙂 to help our readers Learn and get the TECH edge from Analyse India.
Now lets look at what has happened over the last many months and last 2 months.
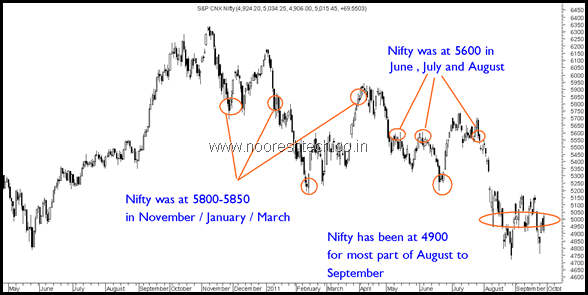
If we look at the Index and just where it was for many months. For 3-4 months the index was at 5800 then at 5600 then at 5200 then at 4900. So every important breakdown or breakout levels was revisited again and again. We have gone no where in last 2 mths been at 4900 but sentiments/technical targets have gone all over the place from 3800 to 6000 :).
How to counter this markets – Lets look at a longer picture and understand how markets function
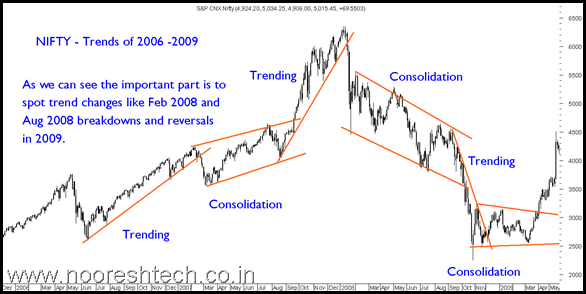
1) 2006-2009
if you look at the below picturethe most important thing technically is to find those trend and momentum change shown by Sloping trendline breaks in Orange.
start of 2007 ( Fall from 4200 to 3500 ) , Sept 2007 ( massive breakout of 4600-4700 ) , Jan 2008 ( breakdown leading to circuits ), Sept 2008 ( Panic fall below channel ) , March 2009 ( Turnaround Signal above 10k ).
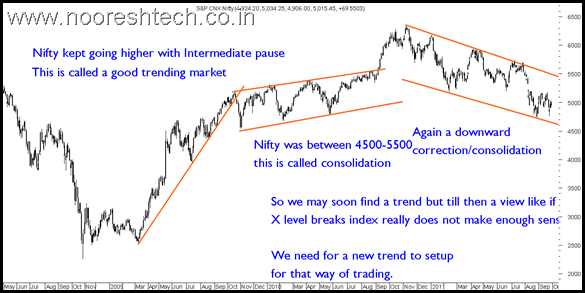
1) 2009-2011
Similarly in 2009 it was important to catch the trend change in April 2009 ( Major Breakout before rally ) , Sept 2010 ( Breakout move of 5600 to 6300 ) and Jan 2011 ( breakdown below 5900/5650 leading to downtrend) from where markets got into a different phase.
So if we look at above charts what is more important is to find significant trend changes as well as Entry and Exit Points in consolidation/corrections.
So couple of thumb rules
1) In a trending markets – New Highs/Lows are Important
2) In a consolidation ( channels ) – More important to find Entry/Exit Points.
From the above two charts its clear that Nifty is currently more in a downward correction and consolidation but not a super trending market so all views like Below and Above may not work. Technical Analysis is about understanding Trends and not just price points 🙂 or numbers.
So all the people who were calling sell below 4800 tgt 4500 got stopped out at 5100. And all the people calling buy above 5100 tgt 5500 got stopped out at 4900. The reason being one needs to look at trends and not just price points 🙂
At Analyse India we try to keep finding such major trend changes and in the above posts there are links to our previous posts from 2006-2007 to show how we spotted trend changes almost every time but in 2008 we got a bit early started buying at 9500-10000 levels ( Accept when you go were not right it helps in the long run).
Current Markets -
As we have been consistently mentioning ever since break of Sensex 19900/19000 or Nifty 5900/ 5650 levels to keep very high cash and we deployed cash every time we went to 17k / 5.2k where we bought and booked at 19k/5.9k.
Over the past few weeks since the breach of 5200 we have started building a portfolio at 4950-4750 levels and slowly advising clients to utilize cash for long term as well as book partial profits if there are quick spurts as major trend is still down.
On the downside we may look towards 14500 and 4500 ( if any panic comes ) as crucial areas of support on weekly closing levels as well as we are keeping ourselves for any trend change alert on either side to increase cash or quickly deploy cash.
We believe god will be gracious to us again and help us time the market cycle change over next few months 🙂 like before.
If you would like to build a portfolio or get guidance on long term investing then do look into our Delivery Gains Product which consists of a model portfolio for long term as well as updates on Indices and short term trades.
FOR more mail us on analyseindia@analyseindia.com
TECHNICAL ANALYSIS TRAINING SESSION
MUMBAI – OCTOBER 1 st and 2nd
Happy Investing
Nooresh Merani


September 30, 2011
Great article…..
I am a novice in the field and this really gives a perspective.
Can impending market sentiments induce a trend.. Or can such info be used to predict any grends…??
September 30, 2011
Hi Nisarg,
Well Technical Analysts dont create trends but try to find and understand the markets.
According to one theory price is equal to sum total of greed, fear and market expectations/sentiments.
September 30, 2011
Kya baat hai Guru ji …. This article has been a gr8 Revision for me :))
Sometimes we get soo Fascinated by the Mkt Movement & Volatility
That
We forget the Basiscs 🙂
Regards
Himanshu Gupta
October 2, 2011
One question:
Seeing DLF charts:
Seems Elliot third wave is due in DLF in next 10-12 days. 1st wave from 175 to 207, then 198 to 224, and now from 215 to 240 on monthly charts.
Also if we apply fibo on fall from 240 odd levels to 175, the 61% retracement comes at 213-214. The stock price is above that level so there are chances of complete retracement to level to 240 on monthly charts.
Both indicators showing at-least 233 price possible in short term
Is this correct?
October 5, 2011
Hi Vivek,
I am not looking into Elliot wave even if i do its only on the index.
November 30, 2011
This has been a really good article. It organizes the past behavious of nifty and gives us a well defined thought process for planning ahead. You have rightly said that we should wait for a trend to setup rather than make risky recommendations during a consolidation phase.
December 1, 2011
Hi Khalid,
Yes in consolidation phase its a period to wait for right opportunities.