 Although i am not a great supporter of Elliot Wave Analysis for a trading perspective as more simpler,effective analysis can be done by classical technical analysis and a practical approach. Following Elliot waves is more an academic exercise with lots of jargon , probabilities , combinations to confuse then to enlighten.
So there could be many different wave counts by different analysts and some may go terribly wrong.
After the view which i gave on April 4 i read on the net and found some bearish Elliot wave trackers have got onto a consensus of C 5 failure and a big B wave coming whereas some Mega Bears believe its C 4 and a massive last wave stil left. Simply put one camp believes 6500 and other 14500 !!! dis is where it gets tricky 🙂 with waves. Many reports have been going around we would discussd that in next post.
Before getting into the detailed view please check the following links to get a better idea !
1)YOUTUBE VIDEO- May 08 and Youtube Video Jan09
2) ASIAN Indices - Trippple Treat
2) Sensex Time Analysis - November
4) Sensex Time Analysis - February
I had put up an Elliot wave view last weekend on April 4 in which i have given a comparison of the last big correction which happened in US in 1933 and the current one in Sensex. Though i dint get enough time to describe the charts but the counts are very clear and pointing to start of a B wave which is a super opportunity.
-- >Reason to compare the above two is as many economists point that current recession is the worst ever since 1933. So alongwith Elliot i have used the time analysis study which i have been posting regularly since March to point out turning points.
-- > Also one thing noticed historically is a BEAR market downfall continues in a lower top lower bottom channel and a time wise pattern like we saw in Sensex of 50 sessions of downfall and a stable pullback of 20-40 sessions. This pattern was broken in the last leg between Jan-March indicating a change. Later it did not make a new low in March mid to end as expected per the time pattern.
--- > The reversal from a major bottom is seen when the retracement move takes a lesser time then the previous downfalls. This was noticed when the Sensex 9700 to 8047 and 10470 to 8047 move was retraced back in lesser time and thats when we have put up the C - 5 failure confirmation chart on the blog. Similar pattern was seen in Dow Jones in 1933.
FOR THE PREVIOUS LINK CLICK HERE !!! -- April 04
For charts click to check the previous ones --
ELLIOT WAVE COUNTS --- DOW DEPRESSION
Current Elliot /Time Analysis /Fibonacci View on Sensex :
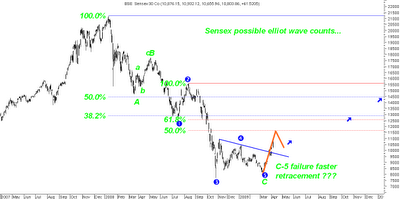
-- > As per my Elliot Wave Count the 3 wave downmove is over with a bottom ( c-5 ) failure at 8047 and this is evident with the faster retracement at 9700 /10470 levels crossed in a higher top higher bottom formation.
-- > Sensex is currently in the B wave which is not a BULL RUN as dubbed by some Elliot wave chaps ( will speak on them in next post ). This move should touch 38/50% levels of the total fall from 21k. Corresponding levels are 12900/14500. This move in the extreme case also should not cross 15700-16k ( 61% level )
-- > In the short term one may see a pullback dip from 50% level of the last wave which is around 11650 or 11200 ( 200 dema ). The pullback could be upto the extent of 38/50/61% of the move from 8047 to 11200/11650 ? . Ideally the important bottom of 9500 which is the latest bottom should hold up to maintain the higher top higher bottom formation.
In Dow Jones the dip was around close to 38/50%.
--- > The time period for the B wave targets to be achieved could be almost equal to the entire downmove which is 13-14 months. So we would expect Sensex may ideally touch 12900/14500 levels once in next 10-13 months or earlier also.
-- > Followed by the B - wave we could see this consolidation pattern and couple of more bottoms before we embark on a secular bull run. We would look into the detail of this phase a year later or whenever we reach 12900/14500 levels.
Some Randomn Thoughts :
In all my views since March when 16k was broken and we cautioned an exit with a video analysis explaining possibility of newer low -- YOUTUBE VIDEO . After that we did make good returns all through the bear rallies from 14.5k/12.5k but were caught on the wrong end in October.
The view had always been about an uncertain and worst economic period around September /October where all skeletons would be out but it was much worse then one could imagine. Followed by that we would see a re-test or a closer low in Jan-March zone and a new thought emerge in March-May period.
The story has gone as expected on the time front all through May 08 to April 09, but got a lil more worse then expected in October. As a future projection on time analysis ( fibo) the next uncertain period comes in Oct end to Dec.
Above all opportunities are going to be tremendous from here on and on both sides.
Best Regards,
Nooresh
noorrock2002@gmail.com
09819225396
nooreshtech@yahoo.com / meraninooresh@yahoo.com


