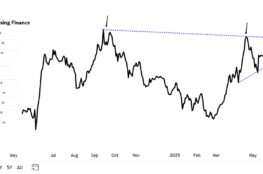
Indices and Ratio Charts - Banking outperforms and Rest Consolidates
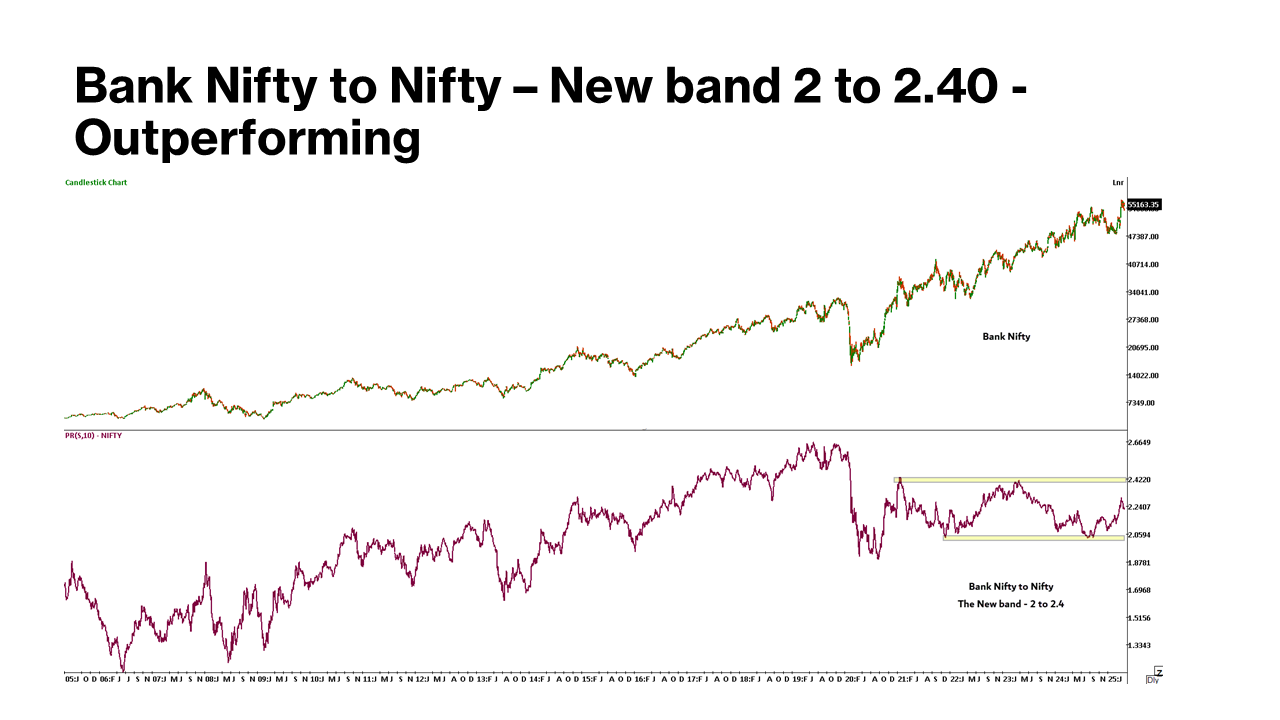
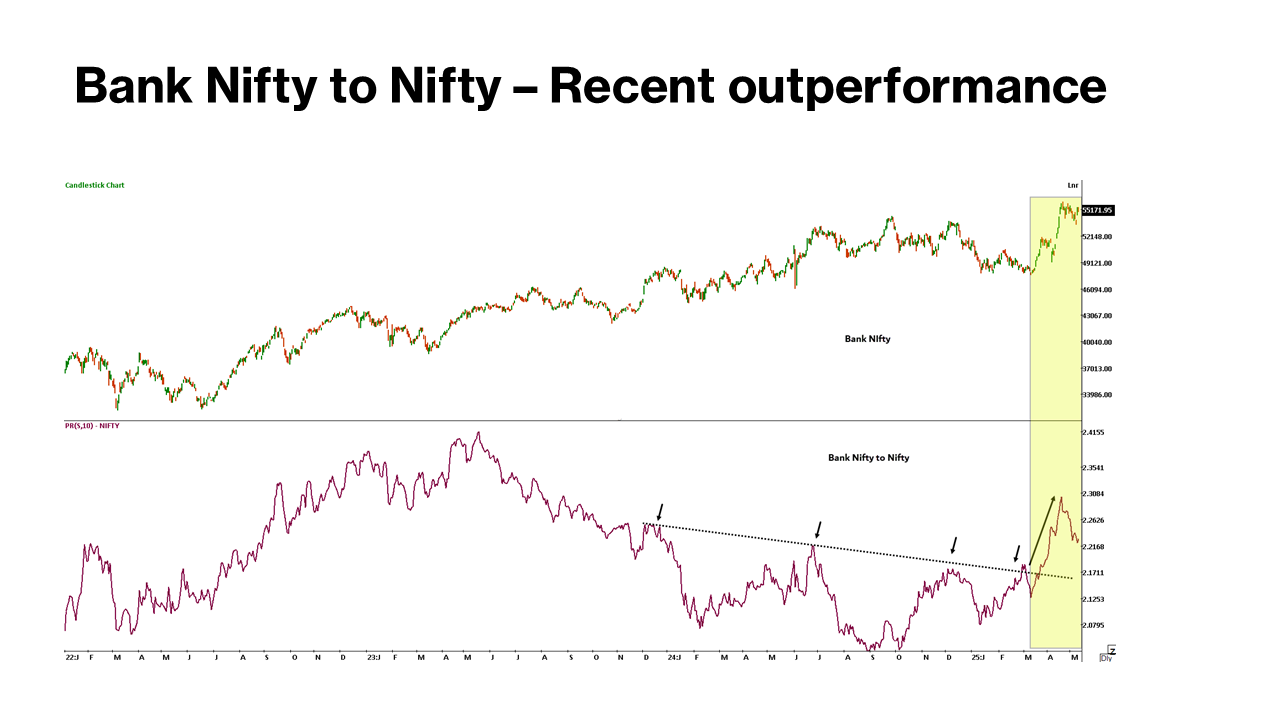
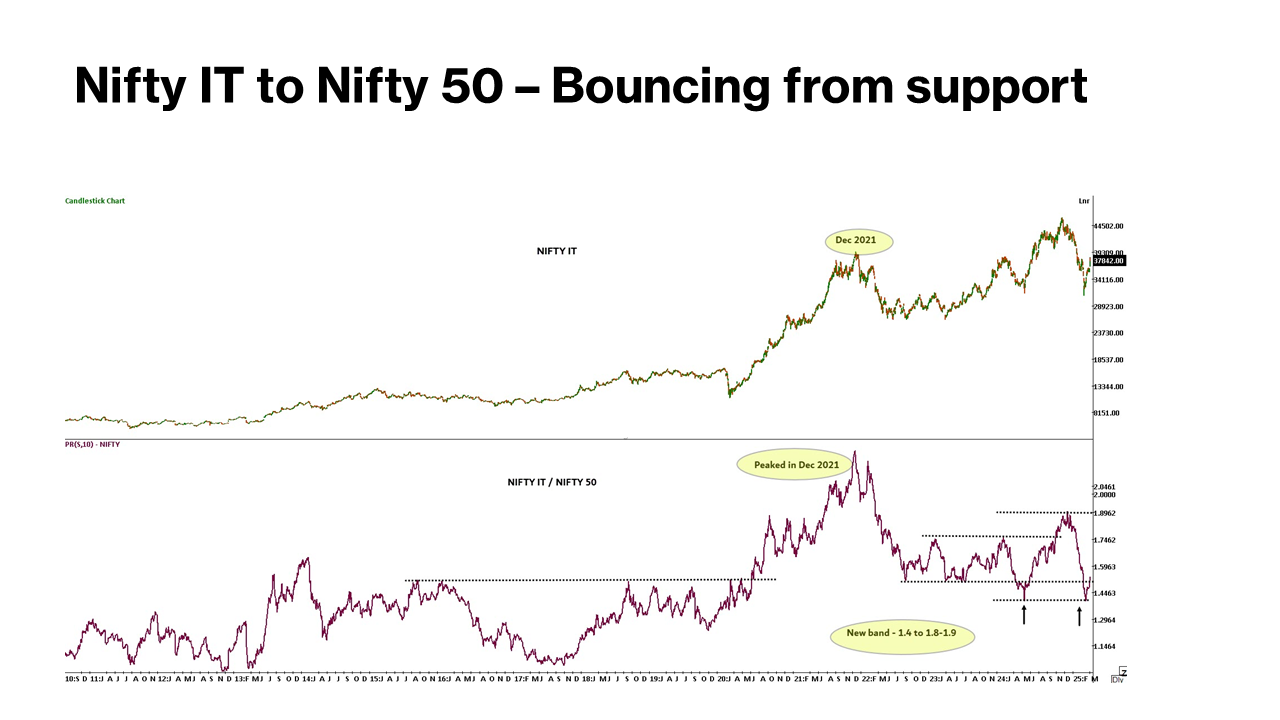
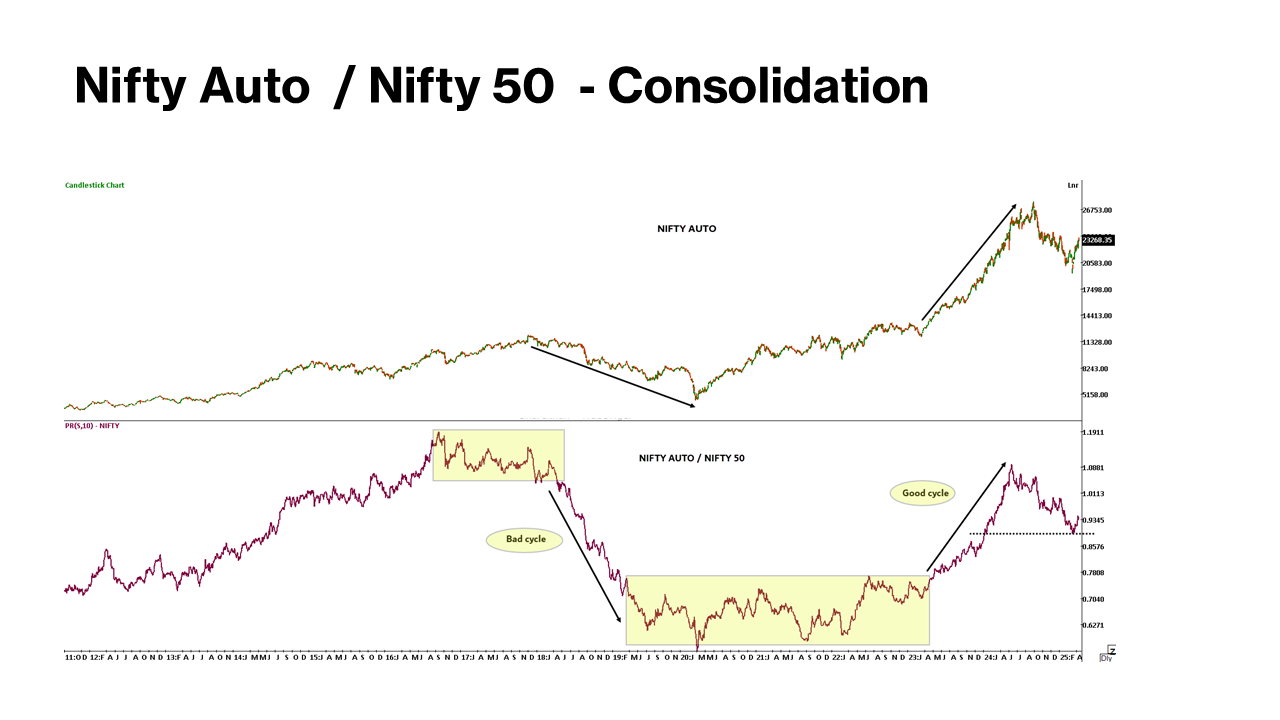
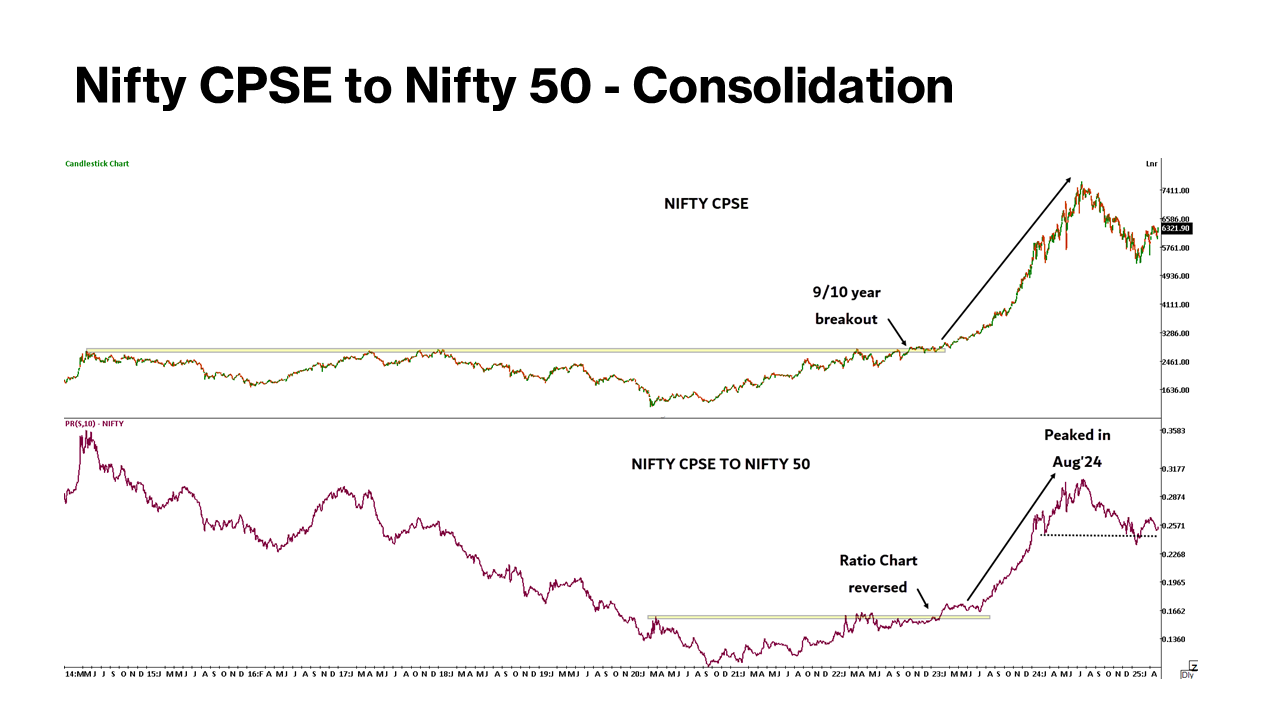
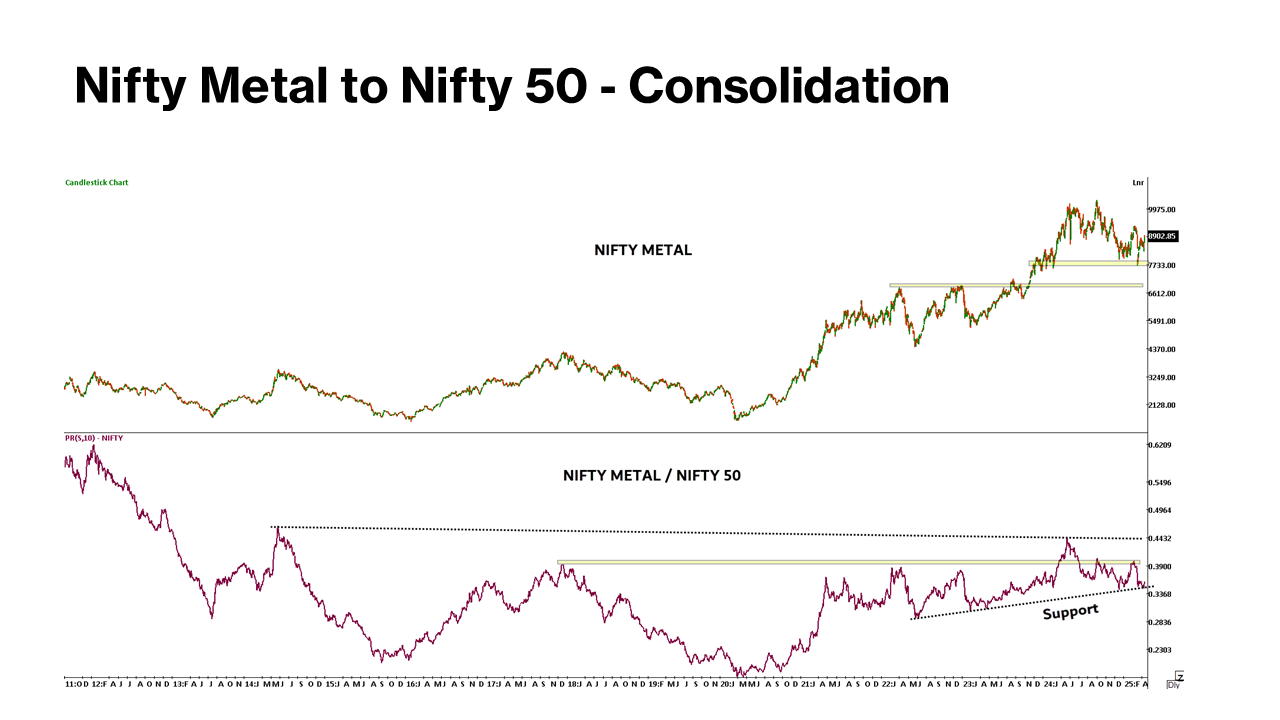
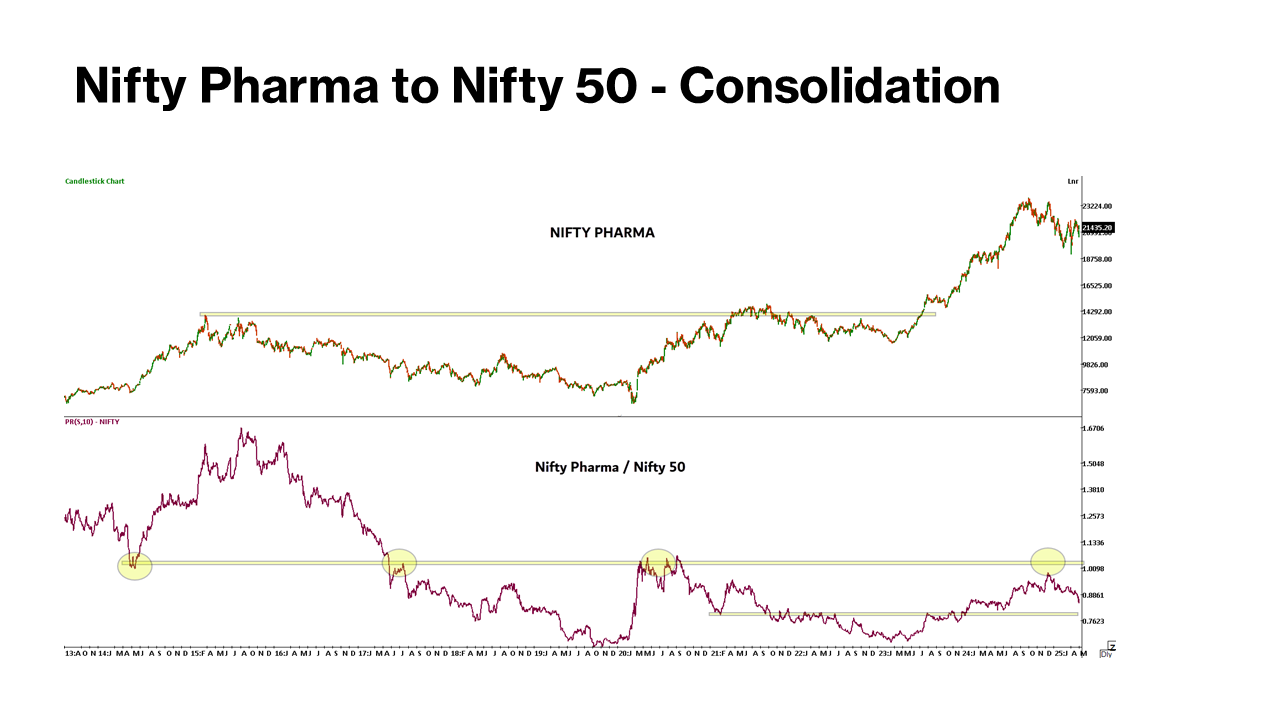
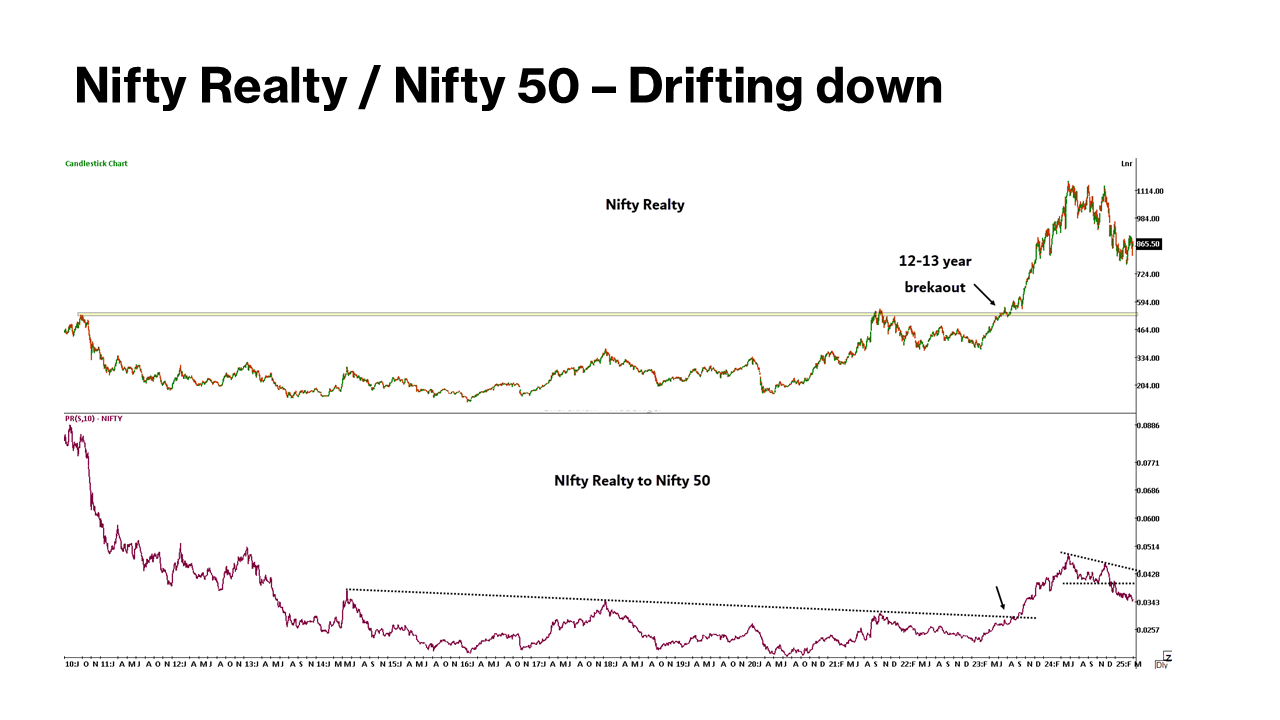
A ratio chart compares the performance of one asset to another by dividing their prices:
If the ratio is decreasing, it means Asset A is underperforming Asset B.
This helps you identify which asset is stronger or weaker over time — a concept known as relative strength.
Using Ratio Charts, One Can
1. Identify Leadership or Relative Strength
2. Spot Trends and Reversals
3. Trade Based on Mean Reversion
4. Use as a Confirmation Tool
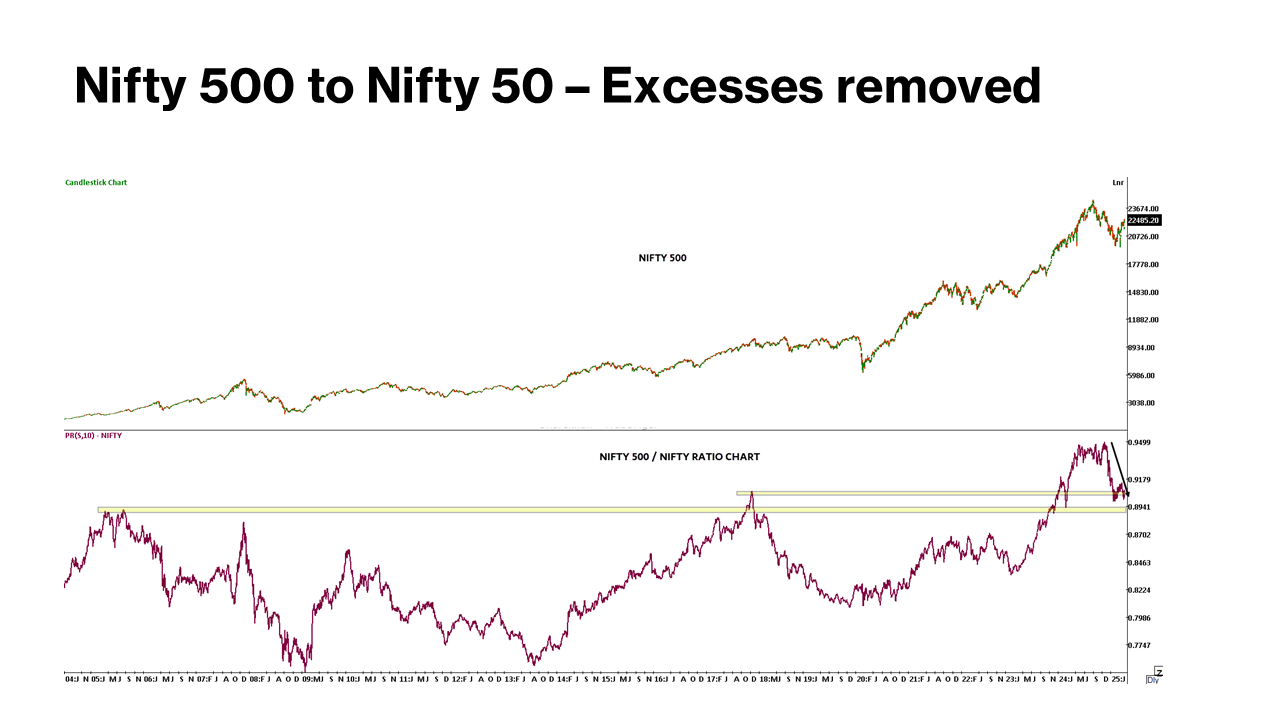
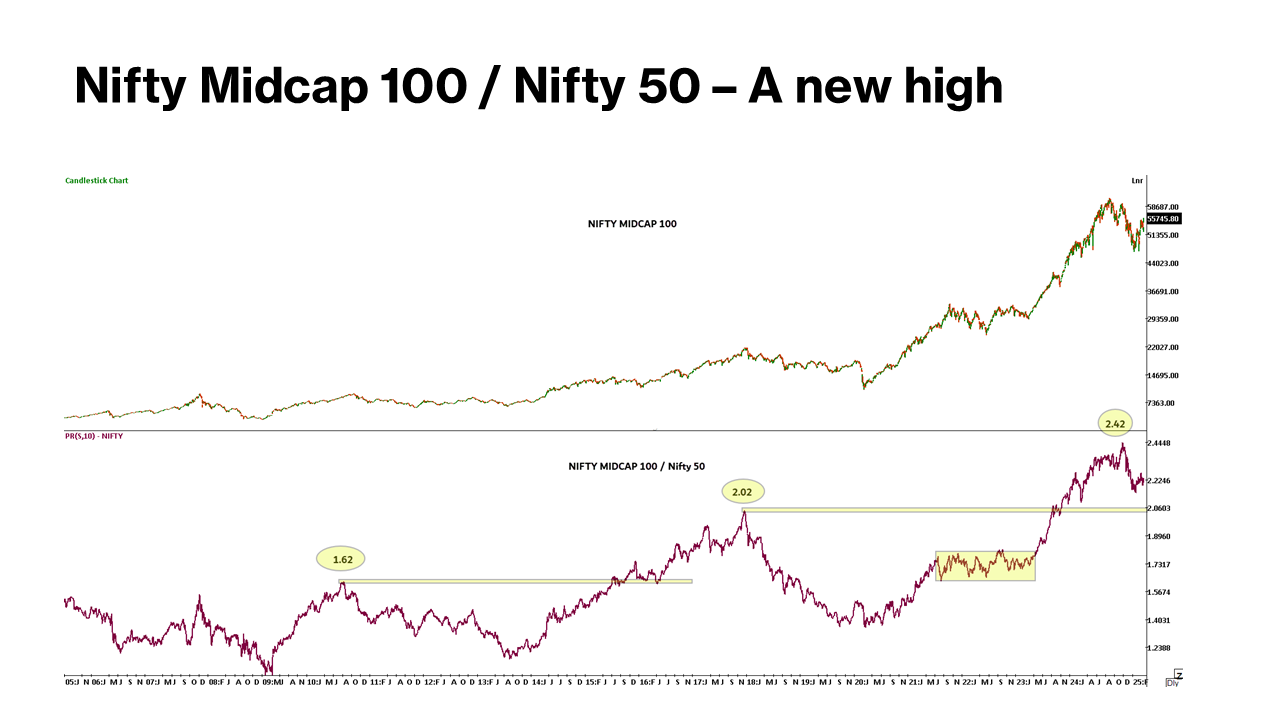
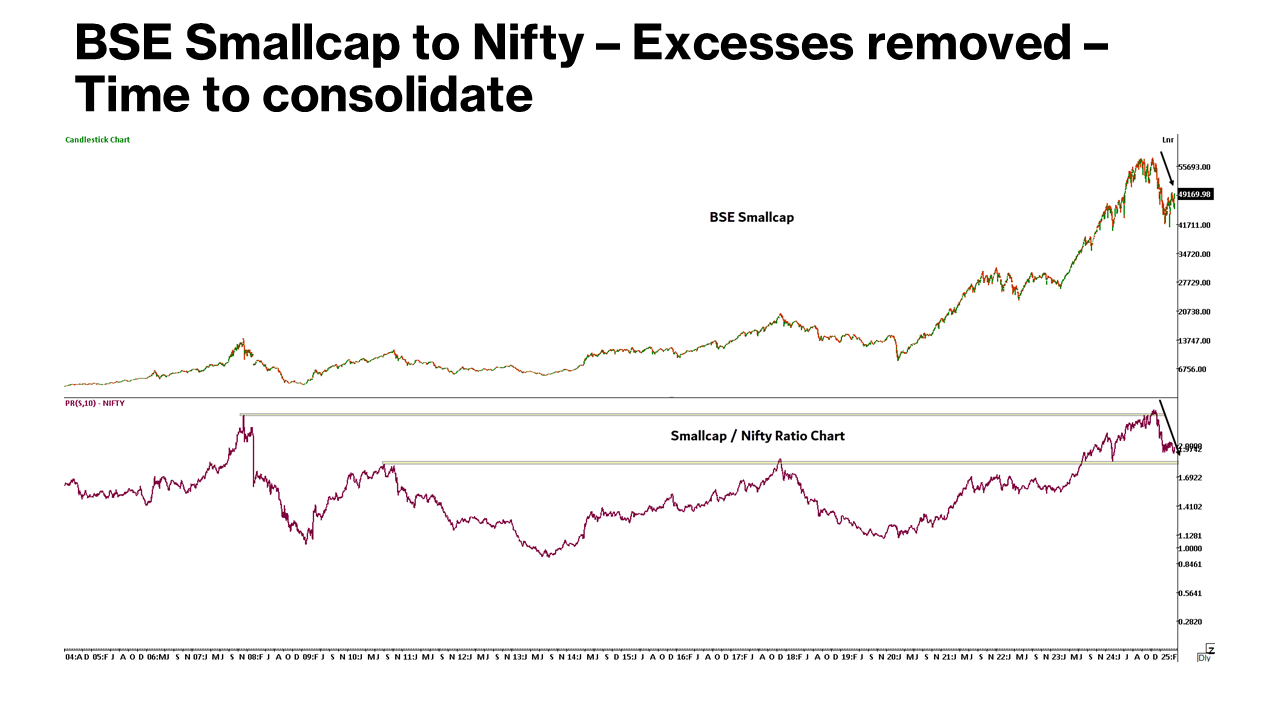
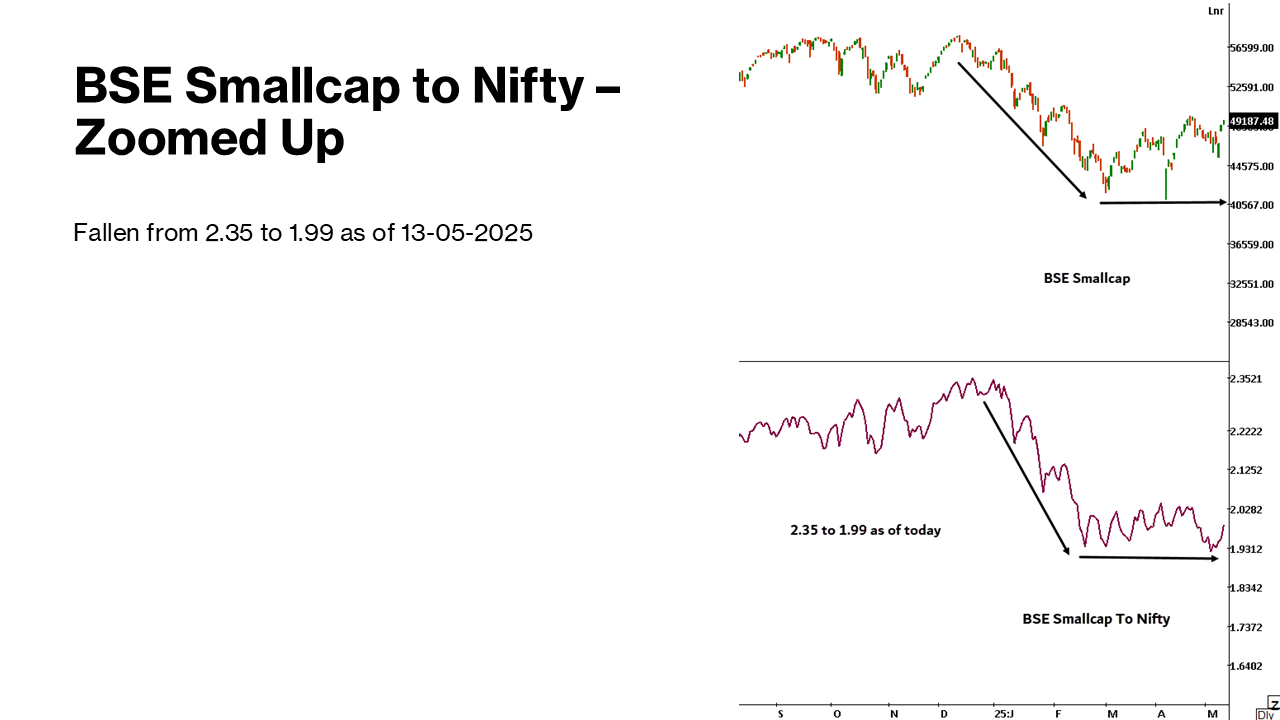
Below are few Ratio charts compared to Nifty 50