Before i go into how a low delivery percentage can be a good screener to understand high risk stocks or speculative built up , circular trading and so on lets look into what it means.
Delivery Percentage or percentage Delivery marked-
Let us understand it through an example.
For example –
Bata India the total traded volumes are 324421
Deliverable Quantity – 35428
% of Delivery Quantity to Traded Quantity – 10.92%
This implies out of 3 lakh shares only 30k shares or roughly 11% of the traded quantity was marked for delivery. This shows that majority of the trades were squared of in the day.
There could be a slight variance if there is short delivery but its miniscule number. You can see the percentage on www.bseindia.com and www.nseindia.com if you look into the get quote as well as in archives section you can see deliverable quantity to traded quantity for a very long span of time.
Now how do we use this statistic for some insights
The thumb rule says Higher Delivery marked with higher volumes and a price rise indicates bullishness and vice-versa.
But one of the major thumb rule is very low Delivery percentage is what is a strong red signal at times.
Let us look into examples which will give us a better insights.
1) Elder Pharmaceuticals – Delivery percentage
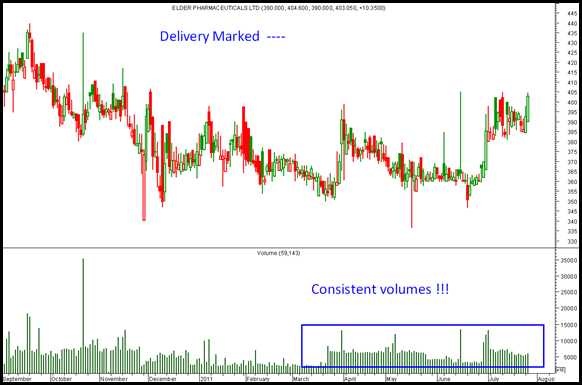
As always i would start with a technical picture which gives me the first hint
The stock chart looks exciting but what surprised me is even though the stock has moved up and down but volumes have been consistent.
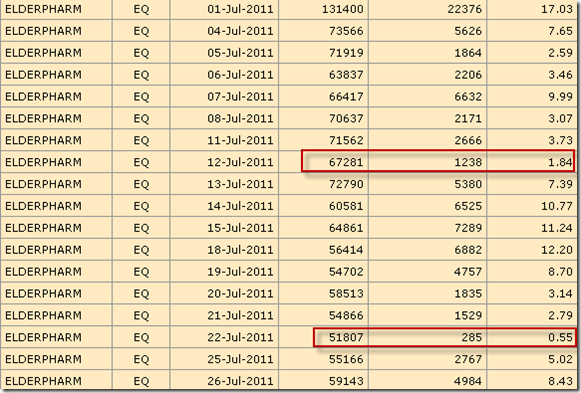
So i had a look into the deliverable percentage
The stock on certain days saw only 1-2% of the total traded quantity being marked for delivery. Everyone knows this stock is not a traders favorite so who has been trading the stock intra day.
Possible questions – Circular Trading, Managed ?
Other examples could be IPO or newlisted stocks
Classic observation – The total traded volumes are way higher then the floating shares. Percentage delivery marked will be 2-5%
Will post few more examples in the next post. Readers can also suggest such stocks.
Previously had posted similar articles on Ushdev International and Jaybharat textiles and Real Estate which later got into the SEBI net.
Similarly had posted about a manipulation on Wellpack Papers and Containers which has come down from 130 to 5 🙂
Mumbai 30-31st July
Mumbai 27th-28th August
Online Technical Analysis Workshop on
August 6th-7th
To know more on Discounts & Details contact: Kazim on 09821237002 or Asif on 09833666151
Cheers,
Nooresh


July 27, 2011
Very good article reflecting on a important parameter on manipulated stocks.
July 28, 2011
Dear Nooresh
This is quite an eye opener.Thanks very much. I have one question though.
1.Does the OBV take into consideration the daily volume plus the deliverable volume at the same time and
2. is looking into the OBV wrt this aspect is a safe bet. ie OBV high and price high means bullishness
July 28, 2011
Hi rajeev,
OBV takes into care positive and negative price action with volumes.
So it doesnot take deliverable quantity into consideration
July 31, 2011
hi NOORESH
SEE FLEX FOOD IT IS A SMALL SORRY MICROCAP COMPANEY. IT IS IN FMCG(FOOD) ITS TRYING TO BREAK OUT ABOVE 36 . ITS A REGULAR DIVIDENT PAYING COMPANEY, HAVING YELD AT THE CURRENT PRICE ABOUT 6%. KINDLY RESERCH TIHS STOCK THANKS.
August 2, 2011
Hi Vijay,
Will have a look on to it.
November 26, 2012
Guys can u suggest me any site where i can download the Nseindia deliverable file manually as i am unable to retrive the data from the nseindia website