In our earlier post -S&P 500 and VIX–Fear at 10-25 Year Highs–Time to Buy and be Contrarian we looked at how US markets have priced in a lot of fear. Nifty had not hit oversold levels but now it has hit a RSI of 23-25 and is now Highly Oversold.
Below we make a conclusion let us try to look at what happens When Nifty is highly oversold. Lowest reading in 2008 start was around 18 and post that 20-25 is the lowest band.
Have done a few videos on RSI on my youtube channel - https://www.youtube.com/user/noorrock2002 ( Can look through them.)
Its a long post ( may try explaining this post in a video soon )
1) Nifty August 2019

- RSI hits a low of 23. Hits a low 10782 on 5th August 2019
- Next bottom at 10637 on 23rd August 2019 . Positive Divergence with RSI at 31-32
- A higher bottom on 19th September at 10670.
- 1.3% lower on 2nd bottom and major rally started after 1.5 months.
- Also notice breaks the sloping trendline and a short term bottom got taken out. Support at previous bottoms around the 10600 mark.
2) Nifty October 2018

- RSI hits a low of 22. Nifty hits a low of 10261 on 5th October 2018
- Next Bottom at 10138 on 11th October. Positive Divergence with RSI at 26.5.
- Another Bottom at 10004 on 26th October 2018. Triple Positive Divergence with RSI at 30.
- 2.5 % lower on the bottom and the rally started after 3 weeks.
- Also notice how trendline and 2 lows got taken out. Support at previous major bottoms.
3) Nifty November 2016 – ( Demonetization and Trump )

- RSI hits a low of 22.5. Nifty hits a low of 7916 on 21st November 2016.
- Next Bottom at 7893 on 26th December 2016. Positive Divergence with RSI at 32
- Marginally lower and the rally started.Almost a month.
- Support taken at previous breakout and Retest. Co-incided the Brexit.
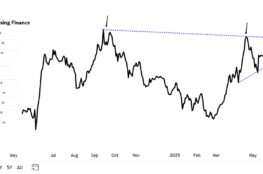
4) Nifty August 2015

- RSI hits a low of 24.5. Nifty hits a low of 7770 on 24th August 2015.
- Next bottom at 7545 on 07th September 2015. Positive Divergence with RSI at 26-27.
- Next bottom at 2.8% lower and the the rally started with an interim higher bottom.
- Broke couple of lows and took support at previous major bottoms.
- The rally fizzled out after a 10% move. Dow Jones retested these lows by a small margin but Nifty bottomed at 6900 in February 2016. Smallcaps were relatively resilient.
5) Nifty end of 2011.

- RSI hit 24 . Nifty hits a low of 4720 25th August 2011. ( An interim bounce to 5360 with higher bottom.)
- Next bottom at 4640 on 21st November 2011. RSI Positive Divergence.
- Another bottom at 4530 on 20th December 2011. Triple Positive Divergence.
- 4% lower on the bottom and a 20% rally in 2 months. Took almost 4 months to bottom out.
- Broke couple of previous bottoms.
- Support taken at bottom of channel and previous bottoms.
- Gold topped out in September 2019. Most global indices bottomed out by November. India and Taiwan did so in December by a marginal lower low.
6) RSI 2008

- Quick Bottom in January 2008 with a RSI hit of 17-18. Two lower circuits.
- Retest and a bounce of 15%.
- Broke the supports in June 2008.
- RSI bounce of 20% in July 2008.
- RSI Divergence Flopped big time in end of 2008. ( Remember buying half intended qty at 10k and seeing 8k on Sensex in next week and 10k back the week after that and then again near 8500 in 2 weeks. Then markets went in a range till March 2008 )
- VIX hit 85 in 2008.
Conclusion :
- Over the last 10-15 years major bottoms in Nifty have been created when it hits the sub 25 band.
- The next low or triple divergence makes a low between 0-5%
- The bottoming out has taken between 3-6 weeks generally apart from 2011.
- Apart from 2015 where the move fizzled out after a 10% pop but many global indices did not break those lows.
- CBOE VIX hit 45 odd levels in 2018/2015/2011.
Nifty at 11100 and RSI at 23.5

- CBOE Vix at 45+ with S&P 500 and Dow Jones showing sub 20 RSI is a very similar fear situation like 2018/2015/2011 and some more previous times. ( there are other bottoms also at 30 RSI. maybe will cover that in a video.)
- In such periods a lot of supports do get broken for a few weeks. Like 11600 is gone and now we are testing 11000-11200 channel.
- Everyone would love a V shape recovery but history does not suggest a V shape recovery. Even if not a full retest but a higher bottom after the bounce would confirm strength.
- If looking at history to repeat the bottoming out could take 2-4 weeks and not very far from current zone.
- Even if there is no retest and positive divergence in coming weeks one may look for confirmation by crossing of intermediate highs in between the next few weeks.
- Such bottoming out is painful and creates a lot of fear but leads to a good stream of trending opportunities with new sectors and stocks in next 1 year.
- In 2011 Gold was supposed to be 5000 in next few years in dollar terms. Still not able to cross 1700 in current panic.
- What excites me is the fact that every time that I have seen 45-50 VIX and 20-25 RSI it gives me jitters but the next 1 year has been very rewarding !!
- Also even today the broader markets and smallcap indices present very interesting opportunities. Time to work harder over next few months.
For Advisory Services–
Call/Whatsapp Nooresh Merani 9819225396 or mail nooreshtech@analyseindia.com

March 4, 2020
Thanks