This is going to be a long post and If i do get time will try to make a video to explain it.
Let me take you through the various Shakeouts, Corrections and Crashes of last 15-17 years. I am doing this exercise for myself to be able to adapt better to Selloffs.
Hopefully it would help investors/traders who have been through it to reflect back into past experiences and react better.
More help to people who have not been through those periods.
The charts used below were in the process for last 1 week.
I get time to write long posts only on Sunday afternoons when my twin boys are sleeping.
So here starts my Sunday Thoughts on the Shakeouts, Corrections and Crash in a Smallcap Index.
BSE Smallcap Index
The S&P BSE SmallCap is designed to represent the bottom 15% of the total market cap of the S&P BSE AllCap. The index is designed to represent the small-cap segment of India's stock market.
The Index has around 688 companies.

The best reflection of the sentiment as there is no limit to number of stocks.
Nifty as an index has 75-80% of the weight to top 20 stocks. So the rest of the universe is closer to the Smallcap Index generally in terms of sentiments and performance.
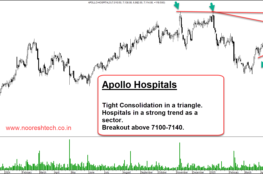
BSE Smallcap Index – The Current Chart.
We will again look back at the chart in the end of the post. Things to note.
- Not more than a 10% correction since the bottom.
- Holding on above 50 dema.
- Higher Top Higher Bottom.

Lets try to understand what does a Shakeout, Correction and a Crash differ.
Every Market cycle the definition changes for everyone with changing volatility. But we will try to have a broad description as per the way i look at it.
After a one way Bull Market we tend to forget that 20-30% drawdowns are part of a Bull Trend in Smallcap Portfolio.
What is a Shakeout
- Generally a less than 10% correction in less than 10-20 session.
- A quick 3-4 day drop where Index falls by 5-10% and a lot of stocks correct by 15-25% in Smallcaps.
- Tough to execute stoplosses.
- A quick pullback follows.
- A sharp recovery into new highs is generally seen in a Shakeout.
- A Consolidation post a shakeout would imply lower volatility and boring period with low volumes.
- Does not break the last 2 swing lows.
What is a Correction
- A break below the lows of the shakeout or the recent swing lows confirms a correction.
- The recovery is not sharp post the shakeout is the first indication.
- Test of the 2nd swing low and mainly the last 3-9 months low.
- A correction could be 10-20-25%.
- Post the drop there could be a consolidation.
- Corrections come after a few shakeouts in a trend.
- More the number of shakeouts. More one has to be careful in buying the first dip.
What is a Crash
- A break below the 2nd swing low or two lower bottoms confirms a major trend change.
- The last 6-9 month lows get taken out.
- Recovery is very feeble and cannot sustain much above the 2nd bottom.
- A crash would generally be more than 20% and towards 30-70% eventually.
- Wait for a reversal and a break above the 2nd swing highs or a classical double bottom or some other pattern. Or simply two higher tops to confirm a trend change.
Now we try to look at various Moves in the last 15-17 years of the available data for BSE Smallcap Index.
I will also make my comments from what I remember from those times.
The Correction in 2005 after a few shakeouts.

- 4-5 shakeouts before a sharp sell-off.
- 5 days 15% gone and a quick recovery but then breaks the swing low.
- Test the 2nd swing low and does a 24% correction.
Observations
Crash or Correction in 2006.

- After the 24% drop the Smallcap Index took just 1 month to make a new high again.
- The rally continued till May 2006 with a few shakeouts and consolidations.
- A sharp 10% sell off in 4 days and 1 day recovery followed by another 3 session fall and Smallcap Index was down 20% in 10-15 days.
- The drop broke the major swing low which confirmed a possibility of a bigger correction or a crash.
- A mild recovery and the index was down 43% in less than 2 months.
Observations.
- The initial 3 day moved like a shakeout and the next move looked like a correction but the global sell off and margin selling etc gave such a quick hit.
- Only the leverage traders would remember it well even today. This wiped out a lot of newbies.
- Sensex was up from 4200 of May 2004 to 12500. So a lot of investors and early entrants had made a big killing and survived.
- This was also the time when sub prime crisis to all the other things got started being spoken off around the world. From a low of 8800 the Sensex rallied to 21200 by Jan 2007.
- Luckily for me I was the least active as Final Year Engg Exams and then a 1 month training in the co I joined. So did not get hit as much.
- Started blogging regularly from October 2006 ( 1-2 posts a day average. Archives are still there if you click on your right.)
The 1 year consolidation of Smallcaps in 2006-2007.


- After the fall in May 2006 the Smallcap Index made a slow and steady recovery and back to the highs of 2006 to again take a correction of 22% in 2007.
- There were 3 shakeouts in that period too.
- The 22% correction tested the last two 2nd swing low but did not break it.
- After this it took another 3-4 months to go back to the same highs.
- The peak of May 2006 could get crossed only in June 2007 !!
- Do you remember this 1 year consolidation also as someone who has not seen those times can imagine a 1 year consolidation in a supposedly 3-5 year roaring bull market.
Observations
- After the correction of 2006 it was a very selective market and there were a lot of smallcaps/midcaps which really did well. A lot of defensives like fmcg pharma did nothing in 2006-2008.
- This was a great period as selective moves were amazing. The Sensex was in a different trend.

- I got full time in end of January 2007. The next 1 year was too crazy. Smallcap Index went from 6000-7000 to 14000 !!
- Starting point makes a big difference in Markets. Being at the right place at the right time is never in your hands – Can call it luck. If I would have got full time in 2008 – dont know where would I have been.
The Madness of 2007.

- Almost 8-10 shakeouts of 5-9% in that 1 year.
- From the lows of March 2007 of 6000 the Smallcap Index made a high of 14200 !!
- If you want to look at what Market Madness and a Crazy Bull Market looks like just randomly open a stock chart for the period of March 2007 to January 2008.
- The initial drop of 12% looked like another shake off.
- A mild recovery and the next fall got sharper. Sensex was making a Rising Wedge unlike the madness in Smallcap Index.
- A breakdown from the wedge gave you enough chances to exit on Monday 21st January 2008. A clear break below swing lows and rising wedge.
- If you did not next day was another lower freeze.
- Smallcap Index down 32% in less than 3 weeks. A mild recovery and by March it was down 52%.
- There were two feeble attempts to recover in March and June but did not last. Even if one took an exit in June 2008 the Smallcap Index and Sensex/Nifty fell another 50% from there.
Observations.
- For example I remember buying a stock up 18% with a possibility that it could be up another 20% next day and 10% after that !!
- Used to have a section called circuit hitters where you buy on a 5% circuit and expect 3-5 more such ckts.
- Its easy to describe that period as madness but everyone was participating and dancing. By end even the most conservative investors were dancing crazily.
- I ll show charts of 2 stocks where I made multibagger returns. Some others are delisted today !


-
Post the 2008 crash the Nifty had not seen a correction of 25% plus till Covid striked in 2020.
-
The corrections of 20-25% were for a year. Consider a years pain getting crunched into 3 days – That was 2008.
-
In January 2008 Nifty/Sensex fell by 22-25% in 3 sessions. In October 2008 Nifty/Sensex fell by 22-25% in 3 sessions after being down more than 50% from peak of 2008 !!
-
I remember losing all my trading profits of 6 months in 2 sessions. Could sell everything in Smallcaps/Microcaps at 5-15 % down on 21st January but the single FNO position ( 100% concentration) opened from 58 to 42-44 with no trade and dropped to 22 next day. ( Was doing a technical analysis training session in Bangalore on 19-20th January 2008. )
-
That single trade taught me the most important lesson. Theoretical Stoploss can be 5% but a gap down can make it a 30% stoploss too even in a liquid stock. Diversification is compulsory on Leverage.
-
Had been on high cash post March – June 2008. Could deploy 50% of cash at 10k Sensex and then saw 25% wipe off in 3 sessions. But October 2008 was not as difficult as you were numb and used to pain..
The reason I talk about 2008 today is that there will be terrible periods in Markets and many of the best investors/traders have seen 30-70% drawdowns and even Wiped out their capital. But never lose your Mental Capital as that is what is going to help you recover and more in next Bull Cycle.
By the way its not necessary you will need to go through terrible periods !! although a section of veterans just dont like it why was it so easy for the investors of last 15 months or even last 12 years ( 2008 was way worse to 2020) , or even from last 20 years.( 1994 to 2001 was a zero return period.).
The Recovery of 2009-2010 and Topping Out.

- After the FED support it seems the Financial Markets should have different dates nomenclature – Before FED , After FED.
- The Drawdowns post the 2008 recovery have been the lowest across the world compared to the previous history.
- There were many shakeouts and corrections in 2009-2010 but a clean break of 2 swing lows in 2010 confirmed the change of trend.

- The Smallcap Index fell sharply in 2010-2011 and the world bottomed out in 2011 and did well over the next few years.
- The Taper Tantrum did not take Nifty back to 2011 lows but the Smallcap Index broke even 2011 lows.
- An eerie similarity to the 2020 fall. A breakout in 2012 and then doom.
Shakeout in 2014-2015 and Consolidation of 2015-2016.

- Before the rally of 2014. There was a tough period of 2010-2013 for Smallcaps just like 2018-2020. The pain in smallcaps got aggravated by Taper Tantrum in 2013 and Covid in 2020.
- A lot of similarities can be seen in the 3 year bear markets of these two times. Also the rally in 2013-2015 seems similar.
- After 4-6 shakeouts the Smallcap Index took a lot of shakeouts in a sideways period of 2015 but did not break swing lows for the next 1-1.1.5 year.
- The 25% drop in 2016 – dont know whether to call it a correction or a crash but the recovery was swift.
Observations
- 1 year of consolidation in 2015-2016 saw selective moves in many sectors but Smallcap Index was flat and Nifty down.
- If you got the leaders right this was the best alpha as some sectors went up 100% when Nifty down 20% and Smallcap flat.
- My personal sense is 2021-2022 looks more similar to 2015-2016 or 2006-2007. Only difference is magnitude of moves much higher in 2004-2007 compared to 2014-2017 so hopefully corrections will also be lower in magnitude.
The 2016 shakeouts and Demonetization.

- Was a clean move from lows of February 2016 with very small shakeouts.
- Broke 2nd swing low post demonetization and US elections.
- Smallcap Index fell 15-16% but made a classical double bottom post that and then a one way rally.
Observations
- Went into a good cash allocation as BSE smallcap was diverging with Nifty and event was getting closer. Deployed on the way up and 2017 was a great year as totally deployed and levered.
- Demonetization in India and Trump in US – who would have thought 1 year after that would not have a more than 6-8% correction in any index in the world. The smoothest bull ride.
The Smooth 2017.

- Shakeouts of 4-5 days and then sharp recoveries for 5 times.
- The global topping out in 2018 got aggravated by the LTCG Tax in India.
Observations.
- Expected a correction and we were light going into 2018 but got it totally wrong as going forward the correction turned into a crash.
- 2018-2020 was tough.

- Good attempt to form a base in early 2018 failed and then the crack continued.
- By 2019 the index was down 40% and diverging big time with the Nifty which was doing way better.
- The trend started turning in end of 2019 and the Smallcap Indices broke out in 2019 end.
- BSE Smallcap Index was back to testing the resistances of 2019 which had already been attempted a few times.
- Covid came out of never and by end of it Smallcap Index was down from 20100 to 8600-9000.
THE BIG QUESTION – BSE SMALLCAP INDEX – A Correction or a Crash.

- There have been 7-8 shakeouts with less than 10% sell off.
- The first shakeout move has been 7.75% till now and Smallcap Index is back to testing the same.
- The test of the 1st swing low at 24000 would mean a 12% shakeout.
- The last major swing low at 19000-20000 is a good 25% away and that would imply a retest of the 2018 highs.
- A bigger correction comes into play only if the Index breaks below 24000. A test of that would be a normal shakeout.
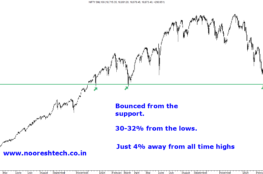
- Smallcap Index is up 3x from the lows of 2020 and is now in line with the performance of Nifty from the peaks of Jan 2018.Both are up roughly 30% plus.
- The Catchup of Smallcap Underperformance is done and that points more towards a Correction or Consolidation and not for madness in Smallcaps from here on.
- Simply put – We might well be looking at a consolidation where it could many months for recent highs to cross on the Index unless we make new highs in less than a month.
- It took 6-7 months in 2005, 12-14 months in 2006-2007 and 12-15 months in 2016.
- One should be ready for a similar period going forward.
- I would be ready to review my view if we break 23500 or 19500 on BSE smallcap Index… the second part I surely do not expect. But a test of 24k and 10-12% dip from peak is possible but something where I would like to do nothing.

- Another Chart which many people look at shows we are far away from Craziness but close to a Consolidation.
What to Do ?
LinkTree - Links to all our services and products - https://linktr.ee/NooreshTech ( Do checkout )
For any queries whatsapp 7977801488 pr mail nooreshtech@analyseindia.com
August 22, 2021
Are you conducting an advanced technical analysis courses ?
August 23, 2021
It is a much needed analysis.thnx
August 23, 2021
Hello Sir Excellent Analysis, could you please help out with your opinion on below stocks and if its good to avg in 2-3 parts starting from sep ?
All of them have posted good increase in net sales QOQ and increase in profits last qtr which was a tough time due to covid lockdowns.
1. JSW Steel
2. Tata Steel
3. Mayur Uniquoters
4. Xchanging
5. Schneider Electric
6. Vardhaman Acrylics
7. Garware Tech
8. Ador Infotech
9. Bandhan Bank
10. Orissa Minerals
11. Praj Ind
12. Akzo Nobel
August 24, 2021
Thanks a lot Nooresh… such an eagles view is really very informative .