For a technical analyst its an easy job to analyze the Global Scenario 🙂 and i do keep checking the same but posting it often does not serve the purpose though.
But everytime i see a possibility of a major turnaround or breakout do try to update on the same.
Some of the must read recent posts on Global Indices.
Do read it to understand how technicals work on all tradable instruments 🙂
1) Gold advised at 1165 now 1270. -
https://nooreshtech.co.in/2010/07/dow-jones-down-by-260-points-global-indices-and-gold-update.html
2) Suggest a dip and bounce back from May end - Precise
3) Big Breakout of 2009 on Indian and Global Indices
https://nooreshtech.co.in/2009/04/flag-around-top-of-channel-state-of.html
Before starting with the Global Indices as i have been mentioning about the Nice Breakout seen in Sensex. Aisa Lagta hai India pehle chal pada :). Sensex has already given a breakout but the rest of the world ( which matters to us ) - U S A , Europe and Hong Kong are still on verge of a breakout in near term.
Will we see a breakout in them soon. Possibly yes by year end. A short term 3-4% correction before the rally gains momentum is possible. Also levels for lower side trend change also seen in the charts.
Things to Note:
- > Arrows put in all charts to show how similar bottoms or trendline supports hold magically !
- > Trendline in different colours showing when the breakout could take place as well as how the trend has kept finding supports/resistances on the lines.
- > Comments posted in the charts to give the view alongwith Levels.
1 ) Dow Jones
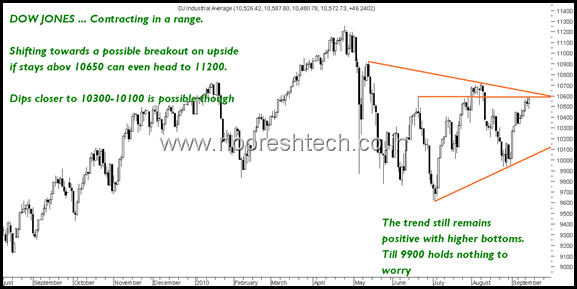
If one see that the last few months Dow Jones has been a tight range. A compressed string has to jump on some side. As of now my bet has been on the upside till proven otherwise by a trend change on downside.
As per the chart it seems over the next 2-3 months if Dow Jones breaks out above 10650-10700 it could even test the year highs of 11200 odd. Downsides to 10300/10100 should be ok.
2) CAC - France
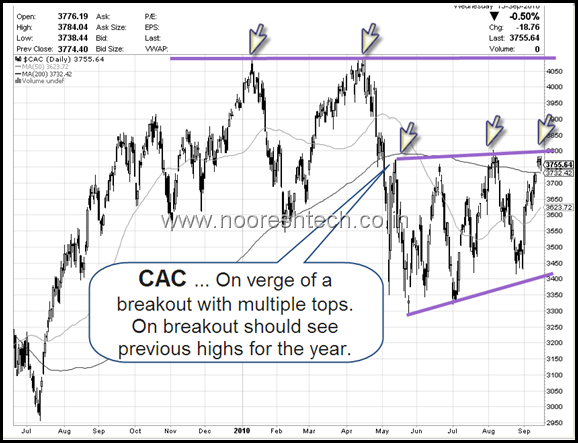
The arrows show how a classical double top was seen in April.
Recently last 3-4 months exact tops seen on the upside. After 4 hits on the upper end of the channel chances of breaking out is highly probable ( Same happened with Sensex now )
3) DAX - Germany
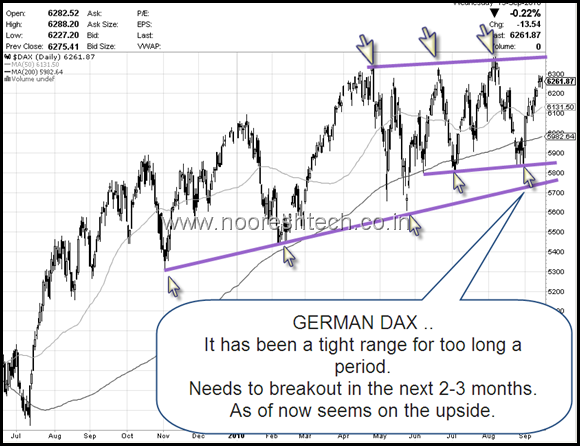
Again a classical double/triple top seen on upside.
Also similar double/triple bottom on upside.
The index is as of now taking the 4th hit on the upside so it might take more time to breakout but a good possibility over next 2-3 months.
4) FTSE - United Kingdom
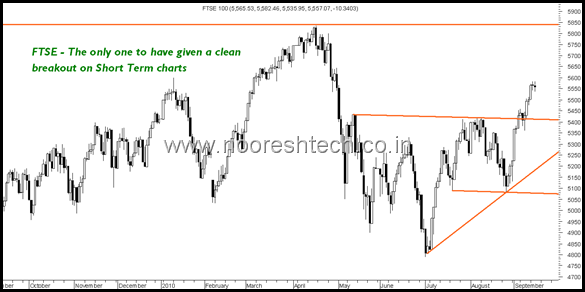
The only other index apart from Sensex which has given a clean breakout on short term. Although Sensex has hit year highs none of the others have.
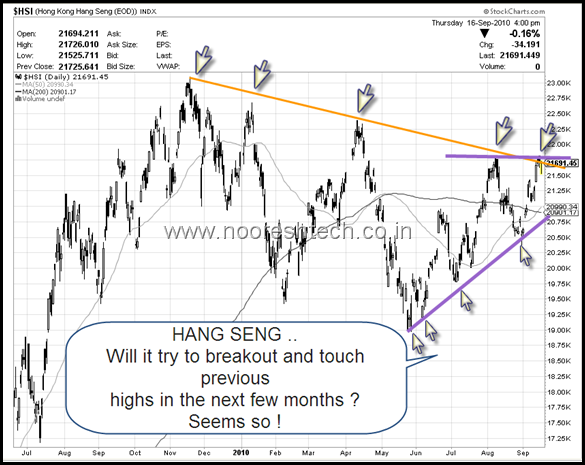
5) Hang Seng - Hong Kong
A steep down trendline suggests its already had 4-5 hits on it. This is an ideal case for a clean breakout above 21.8k on Hang Seng.
Also the lower trendline clearly suggests a higher top higher bottom giving a good signal of a uptrend and momentum.
Recent two tops around the same range shown by arrows.
BottomLine :
The next 1-6 months could be really exciting for Global Indices. Majority of the world is looking out for a Nice decline but Technicals suggests the short term uptrend is intact and if a breakout takes place then we might see a medium term uptrend and a good jump in Global Indices to the extent of 5-12 %.
Sensex seems to have jumped the gun in the race by giving a breakout pretty early. Lets hope the world markets also lead the path shown.
As shown in the charts till we dont break recent bottoms like Dow Jones 9900 or Hang Seng 20.5k we need not have anything to worry on the downside.
Corrections are part of the trending upmove we are in till proven otherwise by markets.
Cheers,
Nooresh

September 17, 2010
Now which level is perfect for buy for sensex with proper stoploss
September 17, 2010
Hi Alpesh.
As of now risk reward is not in favor of longs so need to wait n watch.
Regards,
Nooresh
September 17, 2010
Should we assume that very high inflation or hyperinflation is expected which is driving the markets up everywhere?
September 17, 2010
Hi Amber,
I am a novice with 🙂 economics
September 17, 2010
Your call on Sun Pharma. I did some rechecking for positional.
Here’s what I think it is Nooresh ….
[IMG]https://img25.imageshack.us/img25/1396/sunpharma.jpg[/IMG]
September 17, 2010
umm .. image not showing !!! Reposting …
https://img25.imageshack.us/img25/1396/sunpharma.jpg
September 17, 2010
Hi Nooresh …
Here’s one pattern which is developing nicely …
What are your views on this one ? Am I right in giving the estimated tgts?
https://img829.imageshack.us/img829/1559/bhshipyardweekly.jpg
Murtaza
September 18, 2010
Hi Nooresh if we go by Dow theory FTSE, DOW , CAC , Hang seng all of them have made lower lows except Germany’s DAX and previous low was breached by good 2-4% and made lower tops .. is it not a confirmation of end of uptrend and these indices may make lower lows ??? pl correct me if i am wrong in my view…
September 18, 2010
Hi Shivaji ,
If u see the range of lows was small and not consistent on closing basis.
Dow Theory uses only closing line charts ideally. You can check if they give down signals on Dow on closing lines.
Regards,
Nooresh
September 18, 2010
Sir,
Just one minor Mistake, CAC is the French index and not the Canadian Index.
September 18, 2010
Corrected 🙂 happens when the post is late in the night 😉