Before I start todays post.
Do checkout this new Video Interview done with Samco Securities.
Price Volume Analysis with Nooresh Merani | The Right Choices with Oracles of Dalal Street
Video Link - https://youtu.be/yHmLiW5nOXg
Check the Journey of a Trade – Link for Youtube Playlist
The videos in this series will include Real Trades done in our service Technical Traders Club
Intention is to help our viewers understand, how we spot, enter, exit our trades.
Difference between a Correction & a Multi-Year Top.
There are two things which we have been hearing and reading from good investors/traders and even normal people for last 6-9 months.
All the reasons, logic, analysis seem smart. But is it useful or is it for You?
1) Market has over run, overvalued, heated, euphoric, bubble. etc
This started right at 10000-12000 Nifty.
We are up 20-60 % up from even those price points.
Some of the common statements.
etc etc.
POLL – How much do we Fall on the Nifty ?
There have been a lot of Warnings about how Overheated Markets have been from 10k-16k Nifty. Whenever we top out in the short term How much do we Fall? Just take a Guess and Share with others.
1) 5-15% Normal Correction
2)15-25% Painful Correction.
3) 25-40% like Covid Fall.
4) 40-60% Armageddon like 1992 and 2008.
Please put your guess in this Poll - https://twitter.com/nooreshtech/status/1406554586408636418
I will also put my answer publicly post the poll is over. Maybe a follow on Post.
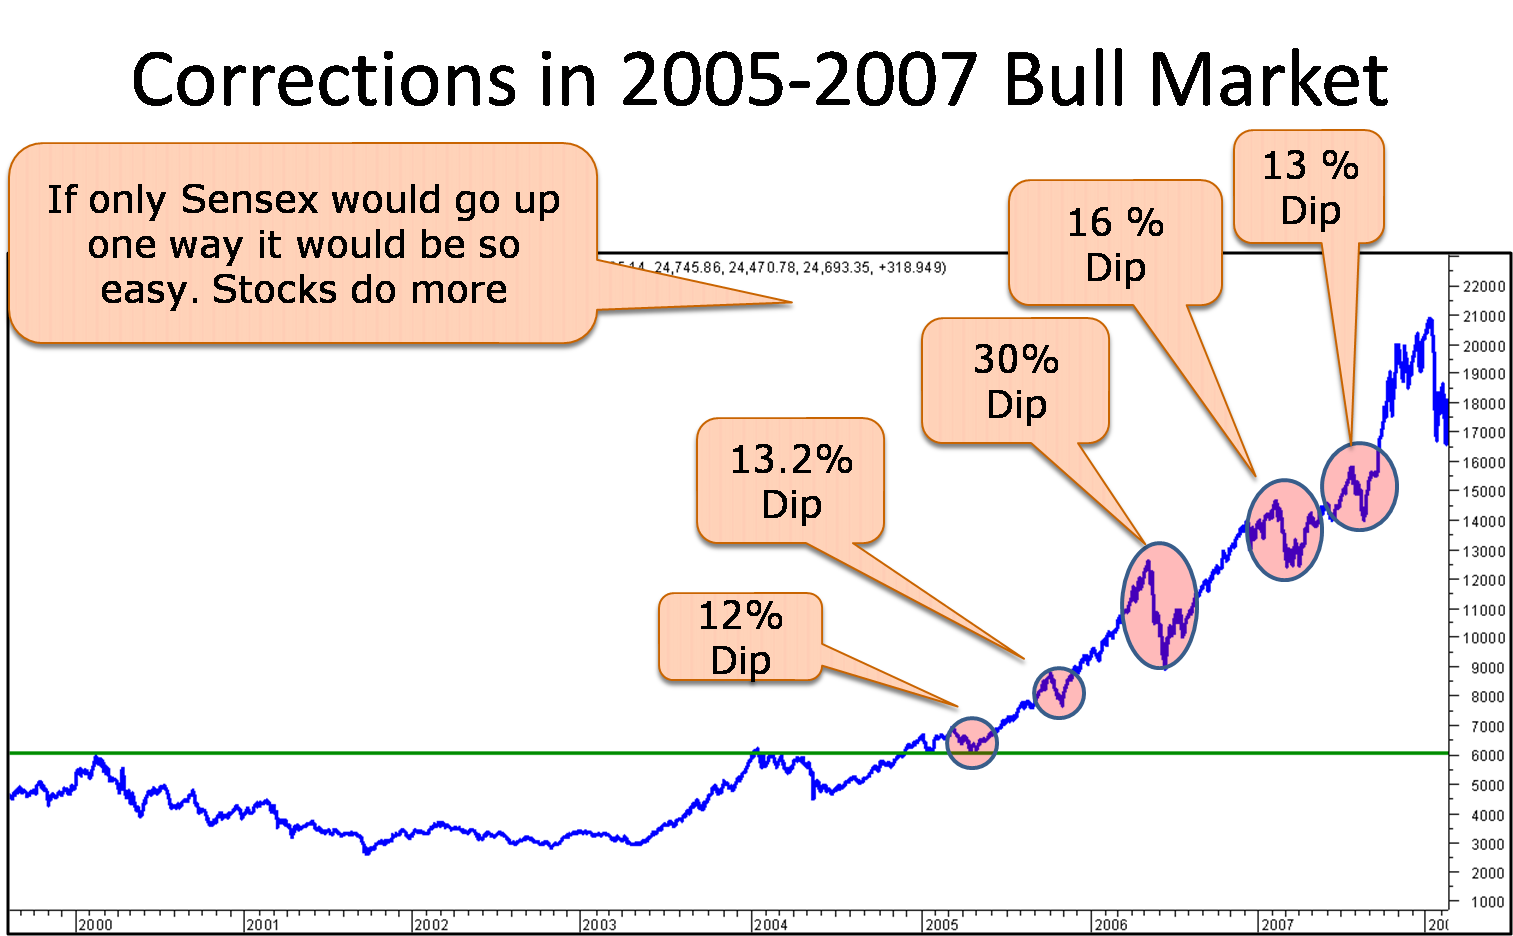
The above poll is to understand the difference between a Correction and a Multi-Year Top.
Sharing 3 charts without any description for now.
Nifty Multi-Year Top & Corrections.

Corrections in a Bull Market 2003-2008
Corrections in 2020-2021

LinkTree - Links to all our services and products - https://linktr.ee/NooreshTech ( Do checkout ) or on the website nooreshtech.co.in
Free Technical Analysis Ebook ( if you have not read yet.) – Analysis that Works
Online Technical Analysis Training Video Course – 1 year Access.