Nifty50 USD – Why to look at this Index.
- FIIs continue to be the largest shareholders of Indian Stocks at 16-20%
- FII flows still remains a big number. Even though DIIs have now started to change this equation.
- Historically tops of Nifty50 USD have been very important resistances.
Nifty50 USD – The tops act as major resistance !!
- Look at how Nifty went from 6300 in 2010 to 2015. But same highs on Nifty50 USD acted as resistance.
- Nifty went from 11100 and made 3-4 new highs but Nifty50 USD highs acted as resistance.

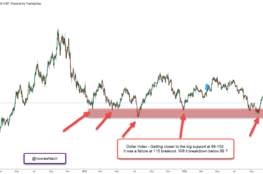
Nifty50 USD –All time highs.
Again Nifty did cross 2021 highs but got resisted at the same band of 8500 on Nifty50 USD in 2022-2023 and saw a dip every time.
Finally a breakout on Nifty50 USD as well.
So the technical structure becomes much stronger. Does it suggest the FII flows could now change to positive.

BSE Dollex 30
A similar breakout. Can see how exact tops around the same highs. Finally now getting close to a breakout.

A few large-cap stocks nearing major resistances.
Adani Ports
Multiple attempts at the 900-920.

ICICI BANK – A sharp move and back closer to all-time highs.

SBI – 600-620 mark remains a big resistance. Strong base at 530-560.

I do keep posting Stock Specific Charts on
– The Idea Lab –
An Idea Generation Platform. and check www.nooreshtech.co.in for all our services.
Check the full product details
The Idea Lab - An Idea Generation Platform!
It's
already been a year since we launched our product as the 'Technical Traders
Room' and we've learned so much along the way!
We've
been listening closely to your feedback, and have decided to make some tweaks
and rebrand our product as "The
Idea Lab"!
The
core concept remains the same – we're here to provide you with potential trading
and investment ideas backed by research methods that we at NooreshTech use
daily.
Here's a glimpse
into what we do:
·
We scan through 1500-1800 charts almost daily by the eyes.
·
Dive into Insider Trading Data and SAST.
·
Keep a close watch on Bulk Deals, Buybacks, Shareholding Changes and Delivery
Volumes.
·
Blogs/Podcasts/Interviews discussing stocks. etc. etc. and much more!
So, what's new
with The Idea Lab?
·
We're now including approximate stop loss and
targets with
each chart.
o
A stop
loss can
serve as a tool for exiting trades that aren't moving in your
favour.
o
The target mentioned is an initial upside
based on chart patterns but trends can last longer, so use it as a tool to
calculate your risk and sizing
·
We're adding our Insider
Trading updates to
The Idea Lab. Tracking promoter activities in the open market has led us to some
fantastic investment opportunities. Check out our Top 10 Insider Trading
Smallcase!
·
You can expect regular
insights on
o Index views,
o Sectoral rotations
o Themes
We've
priced this product very affordably, with a monthly subscription option, so
everyone can give it a try!
So, who should
subscribe?
·
If you're short on time but want to explore interesting stock
ideas.