I have put up a few interesting charts and data in the last 3-4 tweets.
Putting them up in a post.
You can follow me on Twitter - https://twitter.com/nooreshtech
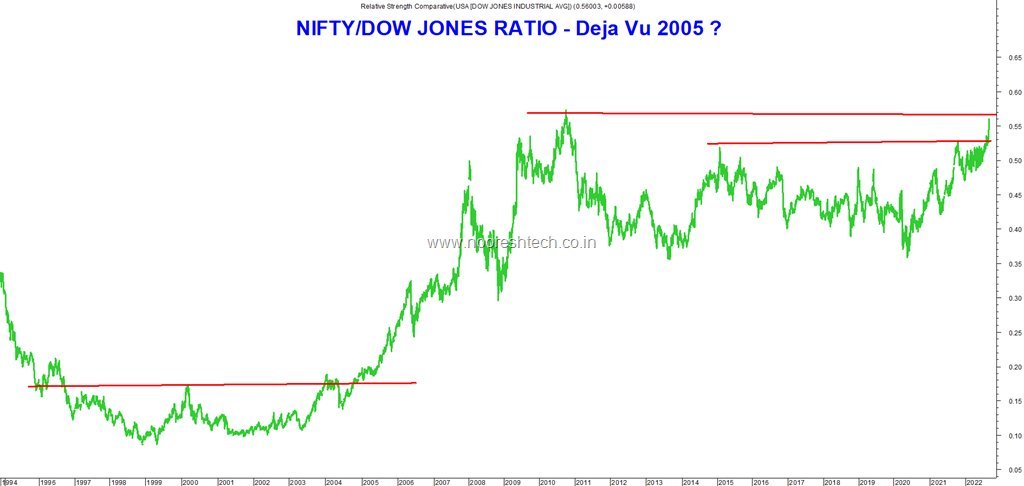
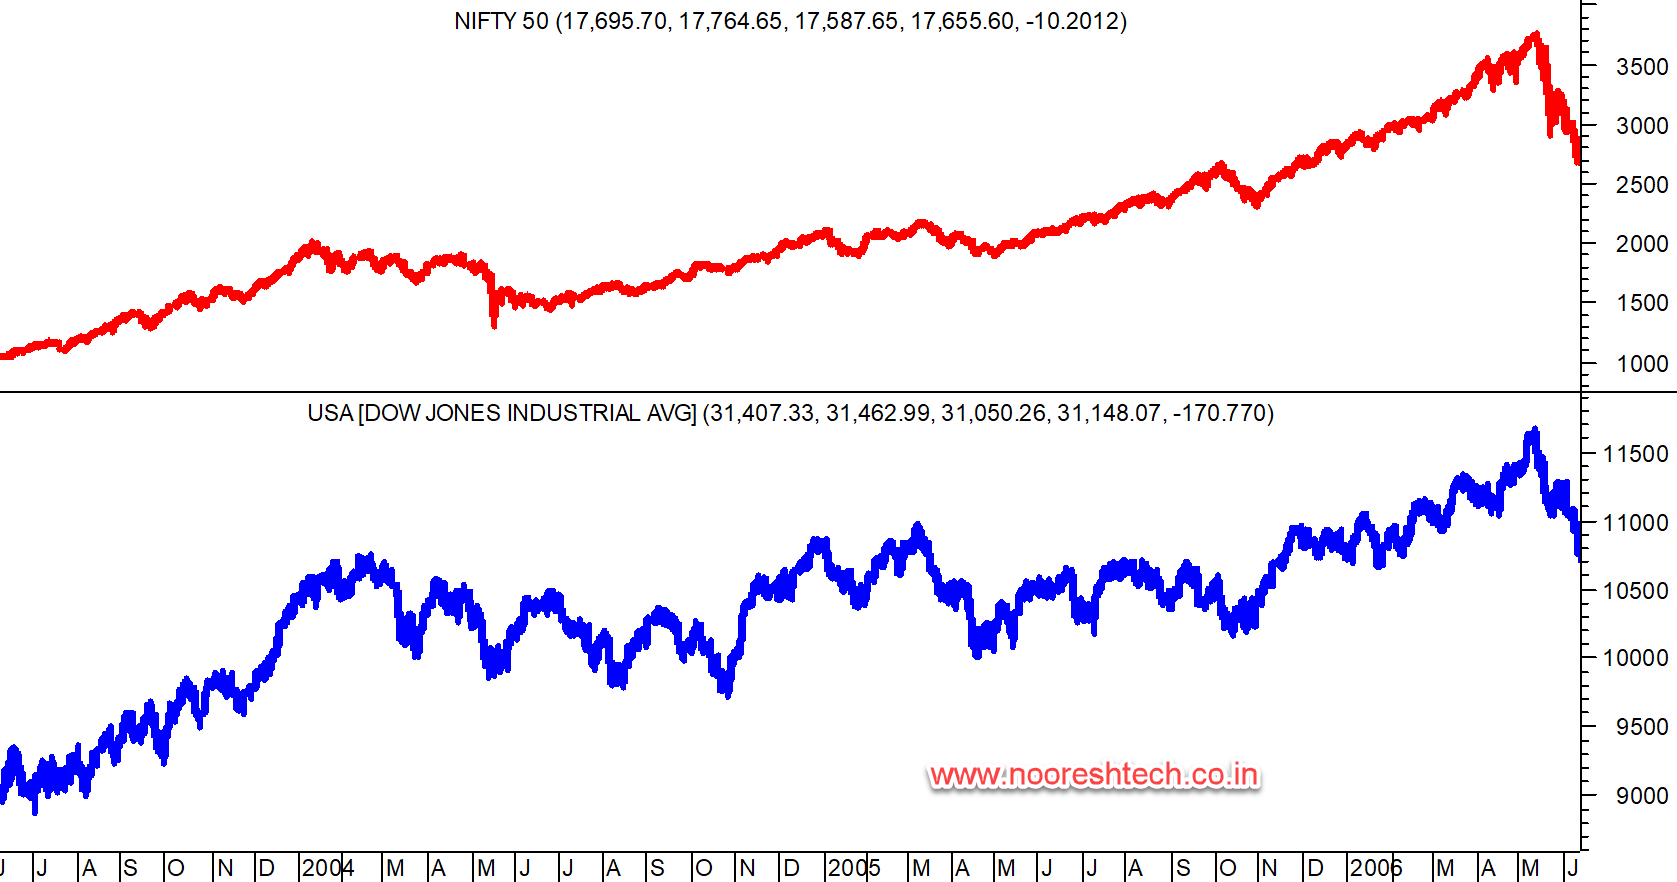
#DowJones and #Nifty in 2004-2005. Can call it #decoupling or #outperformance. Which word you prefer ?
2) Tweet 2
#Tweetstorm
Indias Contribution to World Market Cap hits a new high.Source - Bulls&Bears Motilal Oswal pic.twitter.com/Gmwgoiz1tV
— Nooresh Merani (@nooreshtech) September 7, 2022
3) Tweet 3
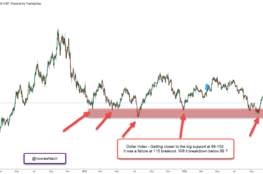
#DollarIndex has gone to 110. Euro INR and British Pound INR are still below 2013 levels. USD INR then was 68 + and today near 80. #Gold has gone nowhere for the last 3 years and is still lower than in 2011 in dollar terms. What to make of this? pic.twitter.com/r7SBJjQrcr
— Nooresh Merani (@nooreshtech) September 6, 2022
4)
By 1996, individuals were putting an average of $25 billion per month into stocks, directly or through retirement plans—equivalent to nearly $100 per citizen.29
Mahar, Maggie. Bull!: A History of the Boom and Bust, 1982-2004 (p. 161). HarperCollins. https://t.co/z7zWHsPpLl"
— Nooresh Merani (@nooreshtech) April 20, 2018
Technical Traders Room – The Hits and Misses – August 2022
TTR – Technical Traders Room is a paid broadcast service run by www.nooreshtech.co.in
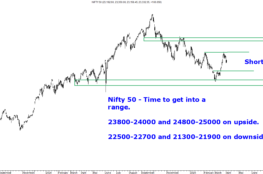
In the charts below we have highlighted a few hits and misses for the month of Aug 2022
Please note we have posted more stock charts in the broadcast than covered below
We have covered only the best and the worst ones here
Link to service: https://bit.ly/3AA11Gg
September 12, 2022
Wise men will say ” inflection point “.