Continuing with our Five Charts to Watch Posts to look at the Trend.
In our last post we looked at how it was too early to fight the trend and let the trend bend. Nifty bounced from 11325 to 11584 which would have stopped out any shorts. Another dip to 11185 to 11618.
Finally Nifty has broken the 11100 last swing low. So now we need to look at the 5 charts with a fresh view.There we go into a long post.
Nifty Price Action.
- Quick Reversal candle after breaking last two swing lows. This suggests we may be getting into a pause rather than a bigger crack.
- 200 dema at 10800 odd although moving averages do not act as clear support levels but is a good reference zone if some reversal signals seen.
- A rise to 11250-11400 a resistance zone to lighten up positions.
- Momentum may shift to positive above 11500. Last top at 11618

Nifty RSI
- RSI oversold at 30 but that does not imply a bottom. But if it is not able to cross 11500-11600 in the next dip we watch for RSI divergences.
- A short term bounce could be in the offing.

There are good chances we may get into a sideways zone with a major cluster of supports around 10250-10550 and 11500-11800 resistance. Historically we see sideways price action going into US elections. Also given Vaccine Trials and a lot more clarity on covid could emerge in coming few months.
Nifty 50 Equal Weight
- It has seen a similar price action like Nifty50 and broken last 2 swing lows.

Do look into our video on explaining how Steep Sloping Trendlines are Tricky and not necessarily suggest a V shape crack.
S&P 500
Went below the last swing low and breakout zone. Holding on to 3200 mark. A bounce in the offing to 3350-3400 to face resistance. The strong momentum now shifting to a pause or a bend. The momentum can shift above 3450-3500.

Dow Jones
- Breaks the swing lows. A bounce in the offing to 27500-28200 to face resistance.
- Major support cluster around 25000-26000.
- The flip flop candle moves after the breakdown suggests going into a pause.

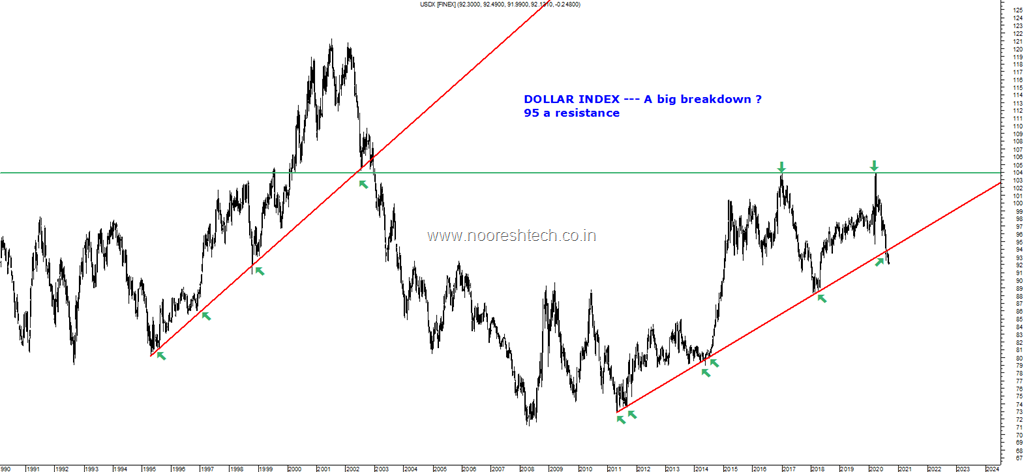
Dollar Index
The longer term picture still indicates a major Risk On and Emerging Market Rally in the medium to long term – Check this image - https://nooreshtech.co.in/wp-content/uploads/2020/09/Dollar-Index.png
- A shorter term pullback is slow and steady which clearly indicates more of a Pause instead of a major Risk-Off face.
- Check how the breakout in Nifty is in sync with the Dollar Index.

BSE Smallcap
The Last Chart and observation which suggests a Pause and not a Crack is that Midcap and Smallcap Indices did not break their swing lows equivalent to 11100-11185.
The Smallcap Indices are generally the first ones to crack in start of a breakdown and momentum. This time around showing strength.
The Index hit a new high due to the Multi-Cap Fund buzz. Do go through this video for – The Big Implication of SEBI Rule on MultiCap Funds ..
The MultiCap Fund Rule is a structural positive for smallcaps but not an instant liquidity push.

The Longer Term Structure looks very good for Smallcaps.
Conclusion
- The Short Term Trend seems to have now shifted from strong momentum to a pause.
- The Flip Flop moves on major Indices in last few sessions coupled with Dollar Index and Smallcap Indices showing strength suggests a Pause and Range Bound moves in coming weeks and months instead of a sharp crack.
- A short term bounce should be used to lighten up positions if leveraged and increase cash or look for sector rotation to shift.
- Smallcaps and Midcaps continue to look for stock specific action as they are showing Relative Strength.
- Nifty may go into a much broader range – A very broad range 10500-10800 and 11500-11800. This pause would be an ideal setup before the next big trend.
- To keep it simple in a Pause its better to Trade Less.
Brief Video on Product Offering – Online Video Course and Analyse with Me -
After receiving a lot of inquiries,Have created a small video explaining the course offerings
Online Technical Analysis Video Course https://youtu.be/fJYX1TP0a6I
Analyse With Me – A Practical Approach to Technical Analysis https://youtu.be/K92k4V_BAaY
( Do Join as quickly for the Oct-November Batch.)
Advisory Services
Technical Traders Club https://nooreshtech.co.in/quickgains-premium/technical-traders-club
QuickGains F&O - https://nooreshtech.co.in/quickgains
For any queries whatsapp on 7977801488 or call on 9819225396 ( after market hours )
If you have any queries can whatsapp on the above two numbers.
September 27, 2020
These newsletters will of great help.