Quite a few stocks making a sideways range for last 10 days and 2 months. Some of them near breakouts. Such a trade is supposed to be with strict stops.
The reason to post these charts is a lot of these charts if they sustain higher implies some sort of stock specific bottom formations happening.
Apollo Tyres – Last 10 days range break.

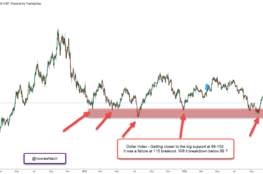
ONGC – 80-81 a critical resistance.

Hindustan Oil Exploration – Good Volumes

Motherson Sumi – Good contraction and breakout.

Zee Limited – Watch for 172-174. Stop 155

NMDC – Small range breakout but volumes and price action needs to pick up.

SPEAKER AT BEAR SUMMIT 2020
My Topic - The Next Bull - Identifying Bottoming Out Patterns after a Bear Market. For Bear Market Summit 2020. Registration Link – Has interesting set of speakers.
Do Read this post if you have not.
Opportunities in Bear Markets and Consolidations post 1992, 2000, 2008 and 2020.
ONLINE TECHNICAL ANALYSIS COURSE
The Full Course on Technical Analysis is now uploaded and can be bought digitally with 1 year access to the recordings.
The Course is divided into 4 sections
Section 1 – Introduction to Basic Technical Analysis Concepts.
Section 2 – . Technical Analysis Chart Patterns, Indicators, Trendlines.
Section 3 - Practical Technical Analysis – How to use it to invest,trade, find sectors, Full time Trading.
Section 4 – Various Softwares and Utilities.
Bonus – One Webinar for Q&A. Batch of 20 every time. Details to be sent on email.
More than 12 hours of content.
Course Fee = Rs 6000
Can buy the course from this link and go through the entire curriculum ( Course Content & Curriculum )
https://www.analyseindia.com/course/onlinetechnicalanalysiscourse/?tab=tab-curriculum
Whenever we add more videos you will get an e-mail for us.
For any queries or payment confirmation mail to nooreshtech@analyseindia.com or whatsapp on 7977801488