Nifty after making a top at 11170 has come down to 10300-10400 a good 6-7% correction.
The Smallcap Indices have gone down a good 15-20% from peak.
Both the indices are back to the highs they made in July-October around the time Nifty made tops around 10000-10200.
The recent outperformance of Smallcaps in October to January seems to have been neutralized. We had discussed this in December end as to how long this momentum in smallcaps could continue - BSE Smallcap Index and Nifty/Sensex–Momentum Divergence–How long can it continue ?
Now after this correction what comes next – Another dip down to make new lows or a Reversal ?
Lets take charts of the indices one by one.
Nifty 50
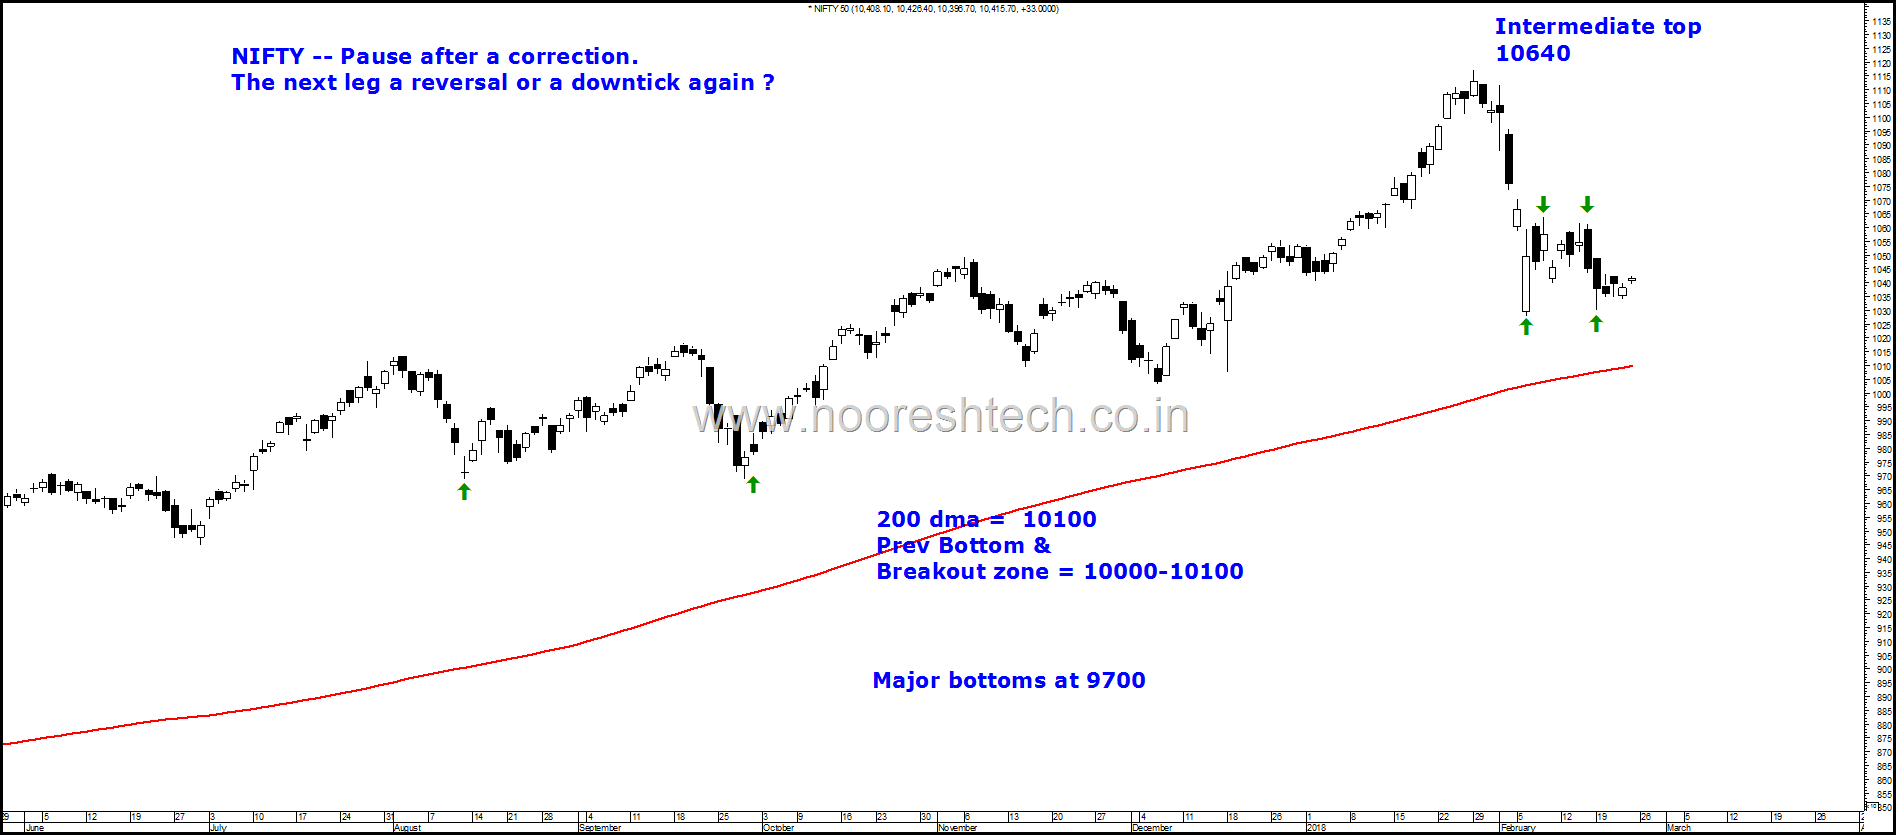
- In the last few days two bottoms around 10276 and 10302.
- Intermediate Top at 10640.
- 200 dma at 10000-10100 and previous bottoms and breakout zone also around 10000-10100.
- Major bottoms in last 1 year at 9700.
- The longer term trend still remains positive as we are still in a steady Higher Top Higher Bottom Formation with last bottoms at 10033 and 9700.
- Ideally a double top bottom confirmation happens post a cross of 10640. But if one wants to pre-empt there a stoploss of 10300 looks a decent risk-reward.
- A much more positional view would be to remain long or buy with a stoploss of 10000 or 9700 depending on time horizon.
- In simpler terms it still remains a buy on dips and not a sell on rise for the medium term also with a good 15-20% correction in smallcaps one can definitely be stock specific. Do look at this post - Smallcaps Down 15-30% from Peak–Time to Buy or Sell ? If one thinks its still a long term bull market the strategy again shifts to deploying cash and fresh cash selectively.
Bank Nifty
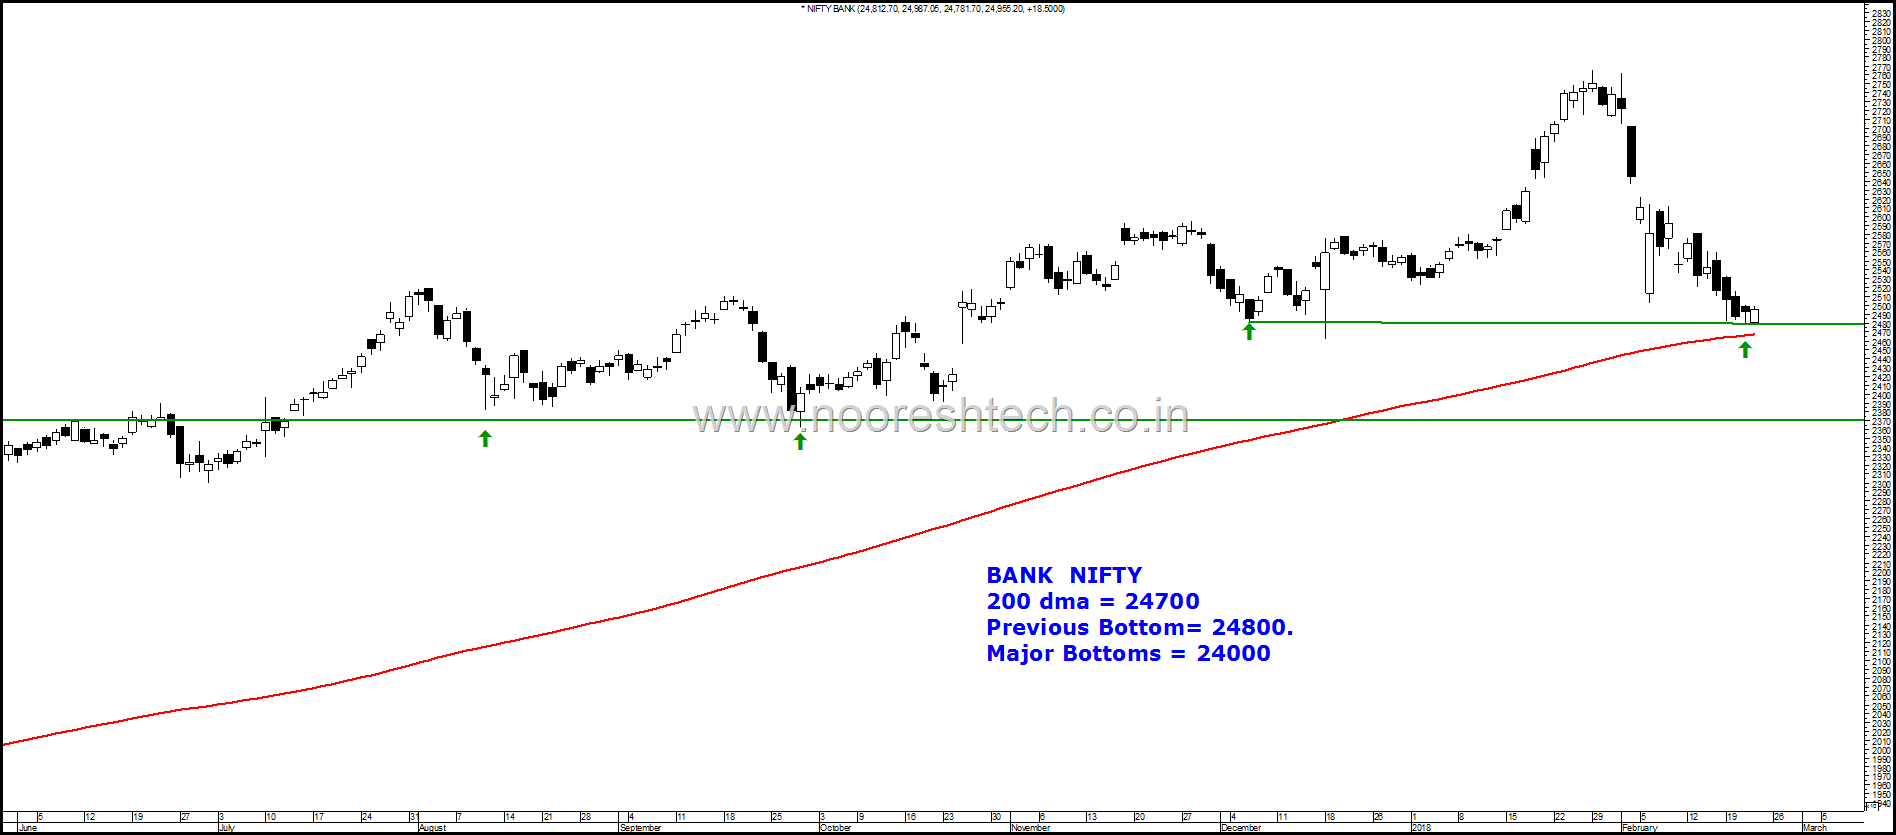
- Bank Nifty has corrected a little more than Nifty with a 8-10% drop from highs and is now back to the lows of December 2017 and has also touched the 200 dma.
- One of the only index which has broken the 6th February lows.
- Its very close to the 200 dma at 24700 and previous bottoms at 24800. The next major support is at 24000.
- The risk-reward is interesting to take a long here but the relative under-performance is a little scary.
- A trend change would be above 26100 or 24000 on the longer term time frame.
Nifty Small 100
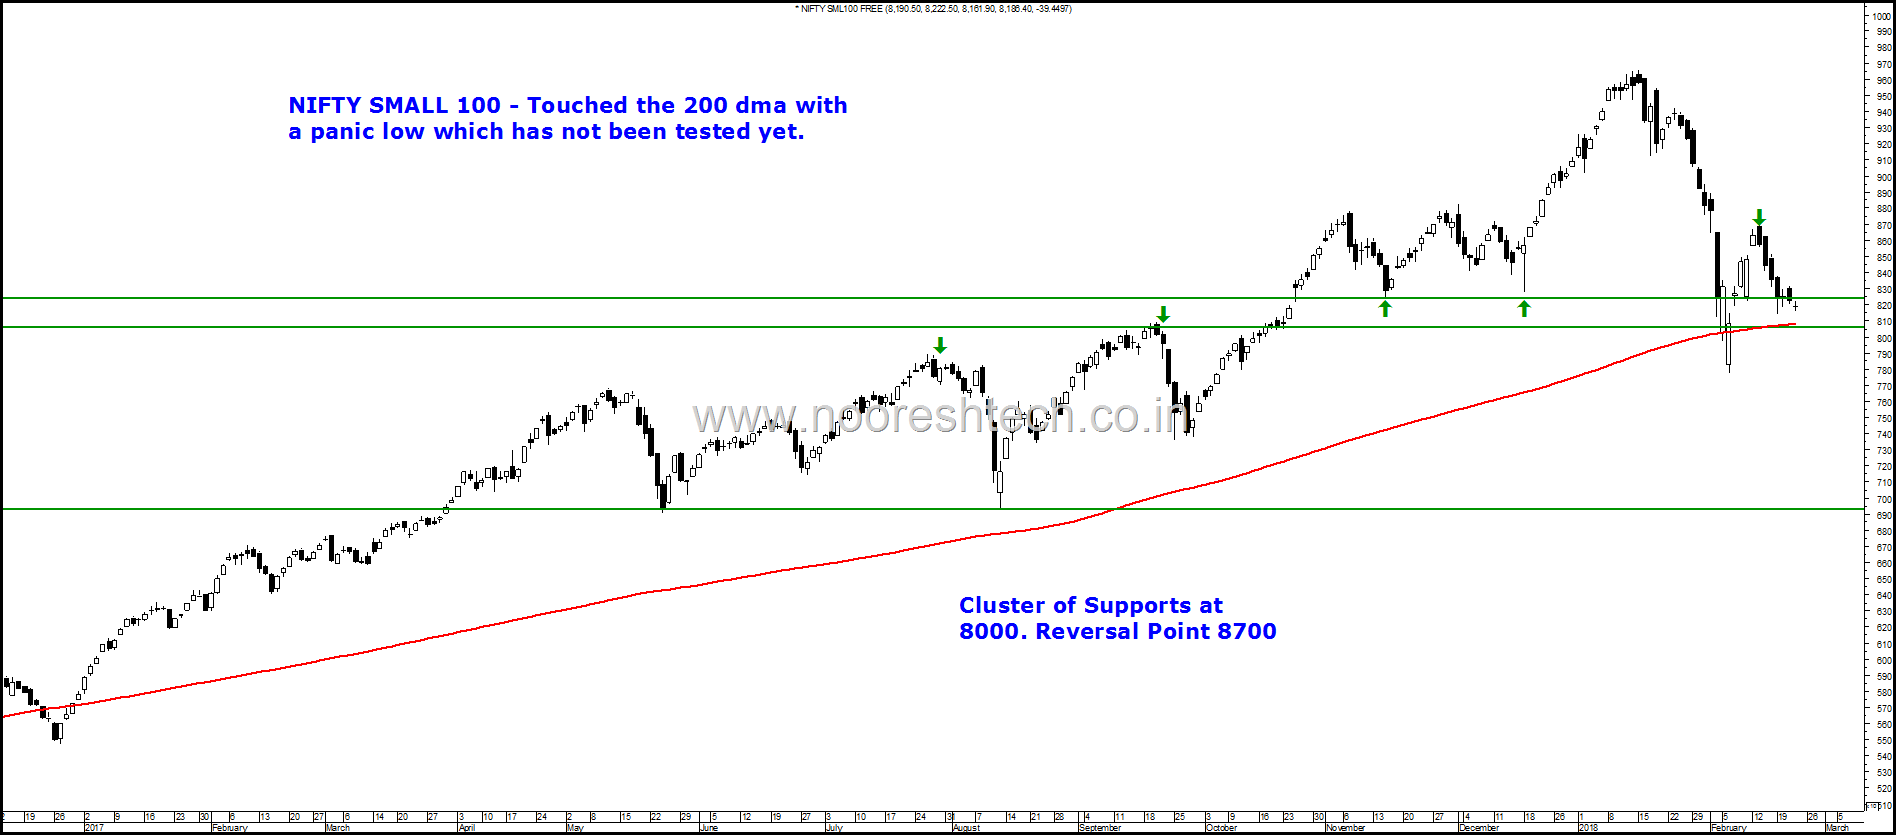
- Nifty Small100 tested the 200 dma and also a little tick below the previous bottoms and previous breakout zones.
- A cluster of supports around 8000.
- The index has not re-tested the 6th February lows which is a good signal of relative outperformance.
- A reversal confirmation would be above 8700.
- The fall now is with very volumes which also is a good signal. The reason to go for selective buying now is not all stocks bottom out at same time so even if Smallcap Indices were to break the 6th December lows or re-test it not many stocks may make new bottoms. A lot of stocks in the bounce from December lows actually made All Time Highs as well.
BSE Smallcap
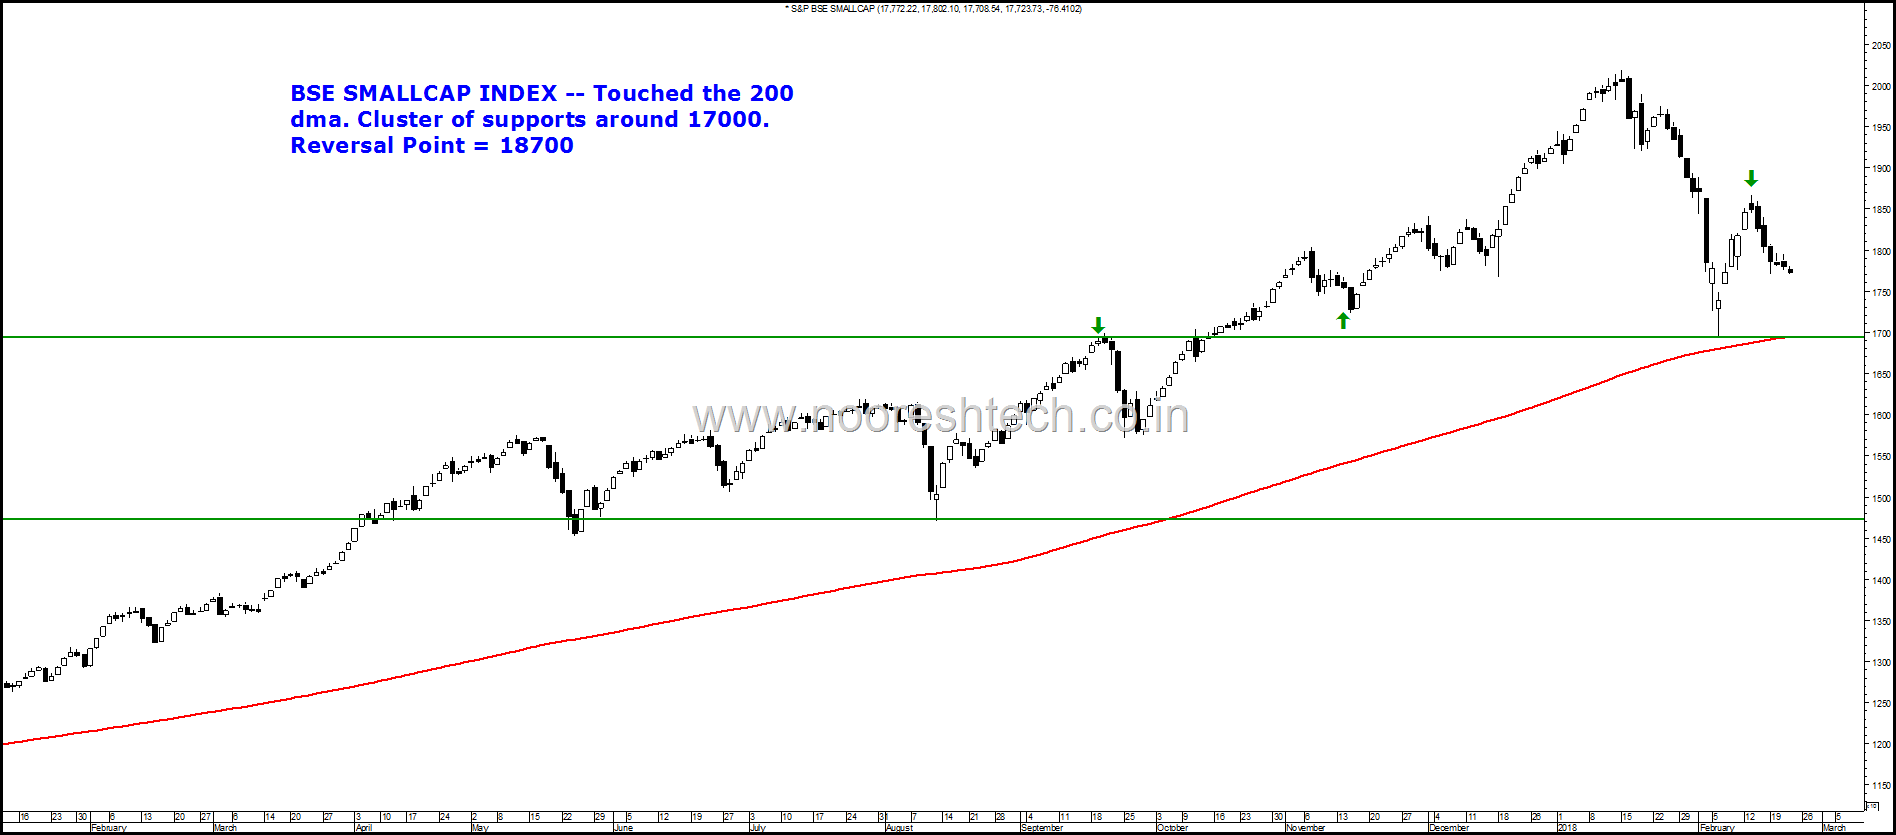
- Very similar to the Nifty Small 100 in structure.
- Tested the 200 dma and has a cluster of supports at 17000 and reversal point at 18700.
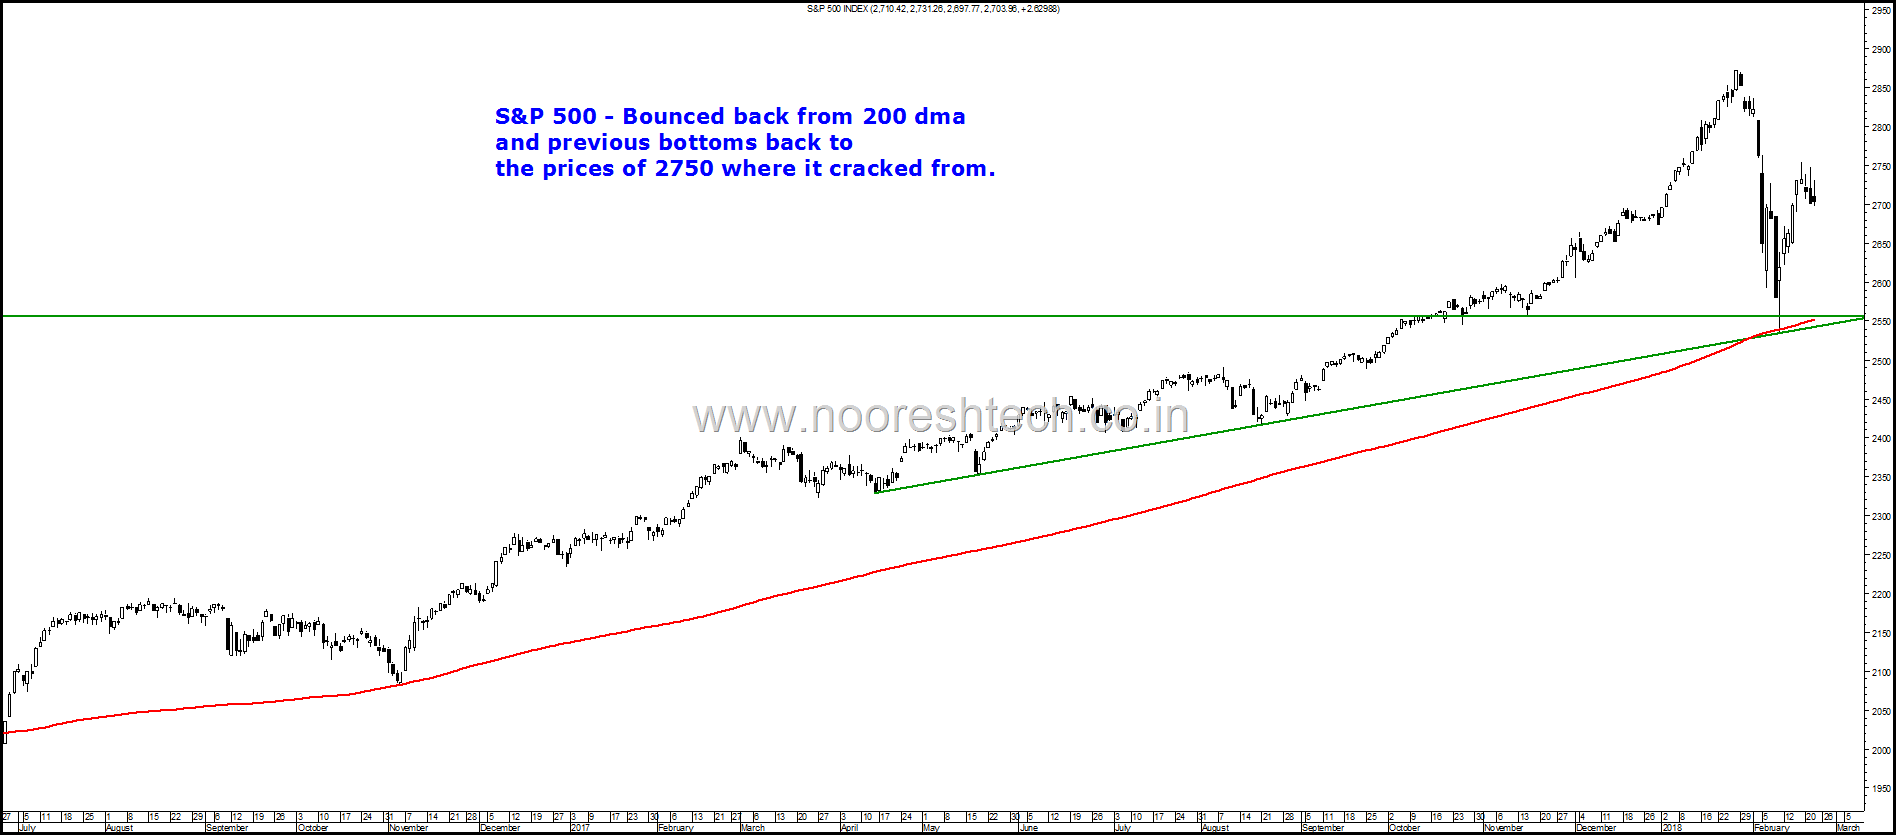
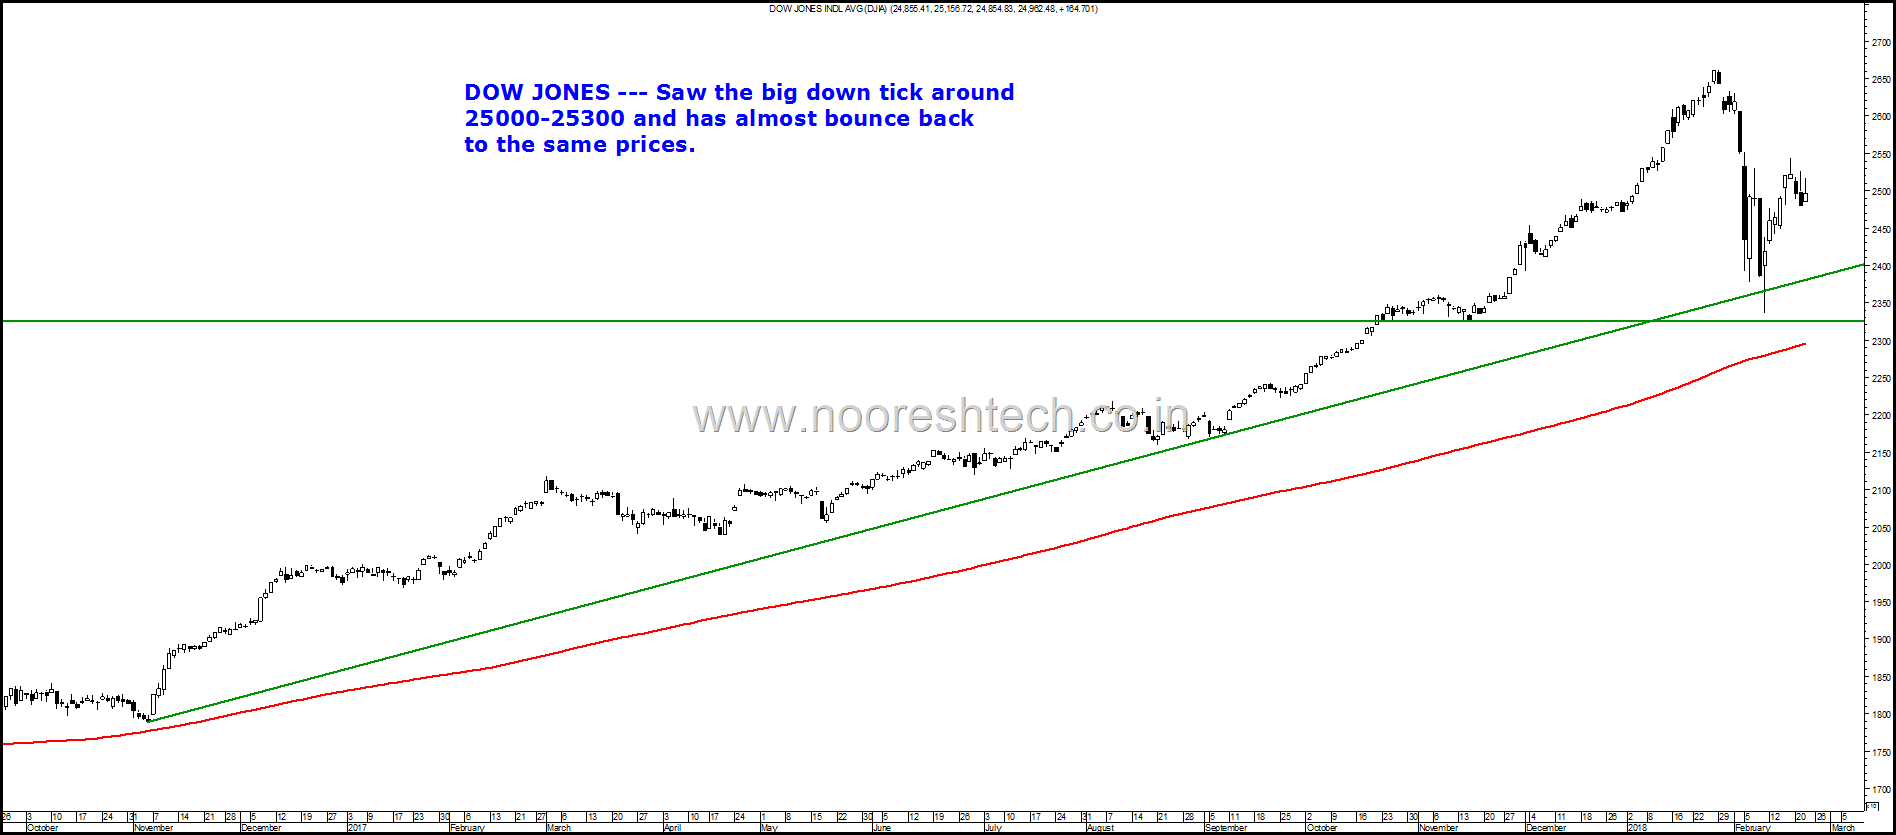
Another interesting case is the fact the Momentum on downside in Indian Indices was triggered by the quick crack in US Indices. Both of the indices have bounced back much better.
S&P 500 -
Bounced back from 200 dma
and previous bottoms back to
the prices of 2750 where it cracked from.
DOW JONES ---
Saw the big down tick around
25000-25300 and has almost bounce back
to the same prices.
Conclusion – This is a good time to be a selective buyer and deploy cash as well as fresh cash and even if there is another down tick be ready to digest it. Very similar to increasing cash in December-Jan and being ready to digest the craziness. This is provided you think we are still in a long term bull market.
Technically a change in trend happens below 10000/9700.
Disclosure – Please do your own research and risk management. The author can be biased !!
TECHNICAL ANALYSIS TRAINING by N S FIdai
10th-11th March 2018 – Ahmedabad
( Venue will be updated shortly )
Maximum participants 20.
Fees - Rs 16000
Payment Link - https://www.instamojo.com/nsfidai/analysis-that-works-technical-analysis-class/
Bank Account Details
Nooruddin S Fidai
ICICI Bank, Yari Road Branch
SB A/c 125101503988
IFSC ICIC0001251
Important Features
-> Learn how to use Metastock Software
-> Small Batch size so highly interactive session.
-> 1 month back up support in case of queries
-> Free Refresher Session any time in next 6 months.*
-> Historical Data since 1979 for practice.
-> Lots of powerpoints/pdfs and training material.
-> Mode of communication Gujarati and Hindi
Fees - Rs 16000
-
And get much much more including access to Analyse India students google groups, refresher sessions, webinars
For more details call N S Fidai 9920120878
or mail to analyseindia@analyseindia.com
More details and payment link.
https://www.instamojo.com/nsfidai/analysis-that-works-technical-analysis-class/

