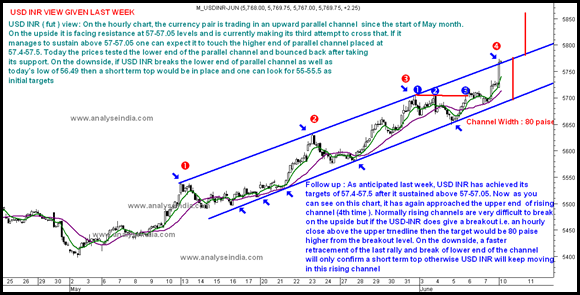
The short term technical view on USD – INR now. Seems the short term channel target will be done.
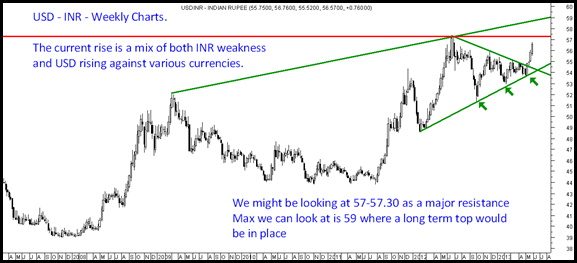
Now comes the more important longer term chart.
Below is a little older chart not factoring the current rise.
On the weekly charts the max we can be looking at 59. Given the negative divergences in the current move beyond 57.3 the rise can continue over next few days and form a major top.
Post the move to 58.5-59 we can expect a slow meltdown back to 55-56 levels.
Good part is we tend to see markets bottoming out with such spikes of USD INR. We will be updating a major update on Nifty in coming few days. Levels we are looking at is 5770/5850 as important support zones.
Nooresh Merani
www.analyseindia.com ( For all our services )
Twitter – https://twitter.com/nooreshtech
Facebook – https://www.facebook.com/nooreshtech


