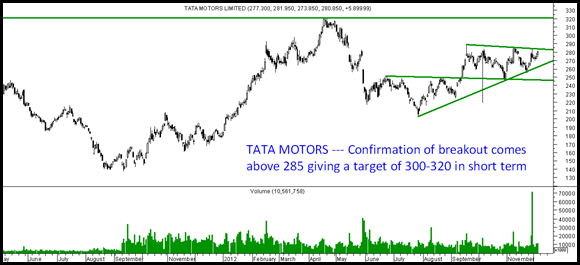
After doing a good re-test of 250 breakout the stock now seems to be heading to a new move above 285
Wait for a confirmation above 285 for a quick trade to 300-320. Stoploss 275
Nice range bound moves indicate move can be sharp on breakout.
TECHNICAL ANALYSIS TRAINING SESSION MUMBAI
DECEMBER 15-16 ( Re-scheduled )
To confirm your participation mail to analyseindia@analyseindia.com or call 09819225396 – Nooresh ,
N S Fidai 099201 20878 , Ankit Chaudhary 09899899989
We would soon be conducting sessions at Banglore, Ahmedabad and Delhi. Interested people may mail us onanalyseindia@analyseindia.com
If interested check the link below.
Regards,
Nooresh Merani


December 9, 2012
Respected Sir,
I am a novice in technical analysis,but still I would like to add my observtions,regarding
Tata Motors charts.
The charts show negative divergence of indicators MACD and Stochastics.
Share price is having horizontal line while both indicators are showing downward slopes.
You are welcome to put light on my observations.
Thanking you,
Bhushan
December 10, 2012
Hi Bhushan,
Indicators may show divergences many a times but will it imply that stock will not breakout. So right now indicators are not showing any positive signals. Also for sample study look at Dr Reddys or Raymonds were they showing positive indications before breakouts.
Personally dont look at many indicators.
We try to take risk-reward based entry trades. So in Tata Motors we may keep a stop below 274 and look for 300-320 with buying
around 280-285.
Above all dont mind going wrong till the time you can be right 65-75% of the time.