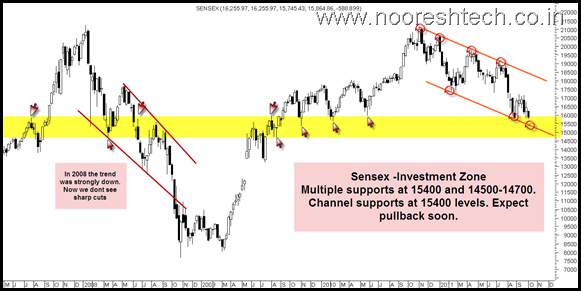
Although i have been consistently posting about staggered buying and then updating to book the same in the past many swings in the market but today will try to look into a simpler chart on weekly basis.
If we look at the chart we have lot of supports at 15400 band and later at 14500-14700.
At the same time if we were to look at 2008 scenario at 10000-10500 it seemed like markets are bottoming out but the Lehmann Moment killed it. Only difference this time around is the fall is slow and structured consolidation whereas last time it was a much steeper downtrend.
Also this time around everyone is prepared for the worst with Options Volatility at 40 levels, Low Leverage , Very less retail participation, Gold peaked out, High cash with funds/investors. Generally market tends to surprise on the unexpected.
People dont expect a repeat of 2008 so it has to be much bigger then creative thinking and neither do people expect a sharp reversal.
So what could be the unexpected --- We really cant predict a lehmann type of moment so we will stick to buying staggered in the investment zone and stick to quality and be ready to take a 10-15% hit on the portfolio in worse case.
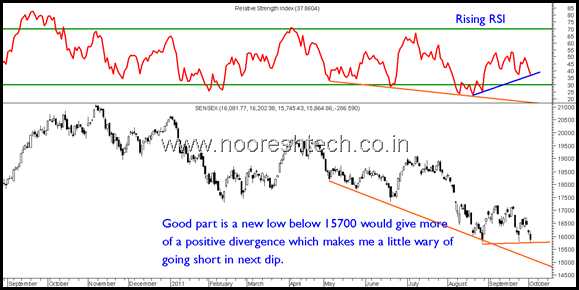
Another chart shows RSI will give positive divergence on any new cracks.
Also as a trader the current dip is not very convincing as RSI is rising in the current fall unlike the previous
dip to 15700 as shown in orange line.
Any new low below 15700 would actually give a positive divergence. This makes me a little wary of taking shorts or would stick to intra sells or max btst in current conditions.
Investors who go staggered from current levels will get a good chance to book partial profits on rise.
Also many index stocks are showing RSI positive divergences !! so risk of getting trap on shorts or stopped out is high. As traders its better to wait out.
Those who would like to know the list of stocks to buy in current sections may subscribe to our Advisory Sevices – www.analyseindia.com
Happy investing ,
Nooresh Merani


October 5, 2011
Hi Nooresh
Can you plz tell what are the parameters that u have chosen for RSI in the above charts.
I have been using 5,3 for RSI and RSI avg on daily charts. N i see no divergence…..
October 7, 2011
Nidhi use 7 or 14 and put it on various stocks on the index
October 6, 2011
Hi Nooresh,
Could you please suggest on below stocks as this would be directly related to the post you mentioned above.. investment zone.
Godrej Ind
L&T
L&T Finance
SBI
Sterlite
Tata steel
NHPC
HCL Info
Lupin
Regards,
Sanjay
October 7, 2011
Godrej Ind —- remains my favorite
L&T —– 1300-1100 SIP
L&T Finance —- Very long term 3 years view
SBI —— Accumulate
Sterlite —– Valuations attractive but will take time to bounce back sharply as its a cyclical
Tata steel — No view
NHPC — No view
HCL Info —– Dividend Yield is good but where is the growth
Lupin — Defensive but expect some short term spurt
October 7, 2011
Thanks Nooresh.
Appreciate your feedback as always!!
have a great day!!
October 10, 2011
Dear Sir
Can you plz tell whats future of KS OIL & MMFSL….
October 10, 2011
Hi Anas,
K S oils difficult to say but MMFSL has lots of cash but we dont know the litigation and fines it will have to pay