Although i am not a great fan of RSI or any other indicators but do look into it when required.
Ever since 2008 we have seen the index reversing sharply whenever it goes into the oversold zone.
As per todays trading the index RSI levels are closing in to the oversold zone. Only on deep corrections like Jan 08 and Oct 09 has the Sensex cracked much below the RSI level.
Ideally index can take support any time in the next few days. In a deeper correction scenario another 200-350 points and index could see a sharp recovery.
Bottomline : Time to cover shorts or keep strict trailing stoplosses. Small longs can be initiated at current levels with a view to add on further declines or on turnaround.
We would look into the charts again in the next couple of sessions.
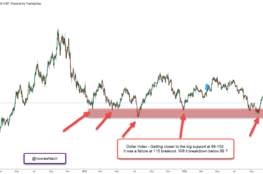
Just check the chart below with the labelling in RED for RSI and index behaviour.
 To learn technical analysis
Keep reading this space for our technical analysis training session schedules.
Technical Analysis Training
Delhi Feb 6-7 ( only 2 seats left )
Best Regards,
Nooresh
09819225396