Magic of Trendlines !!
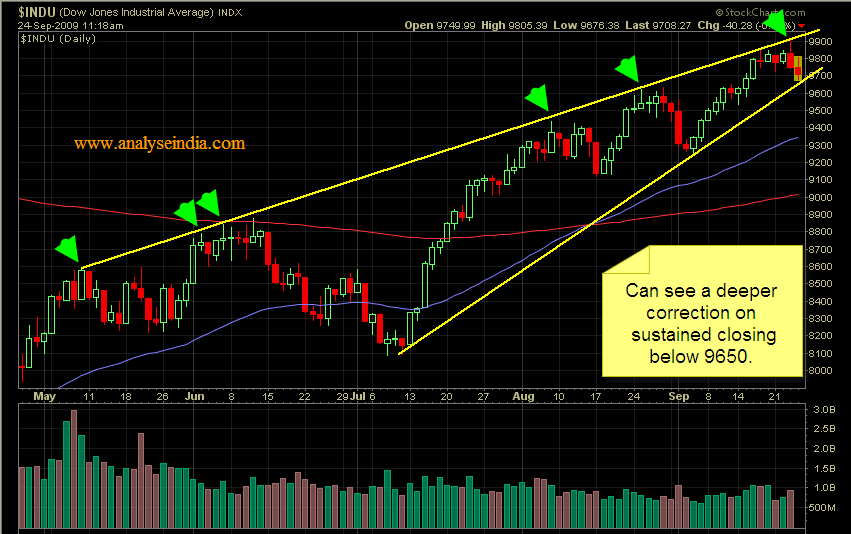
 Dow Jones :
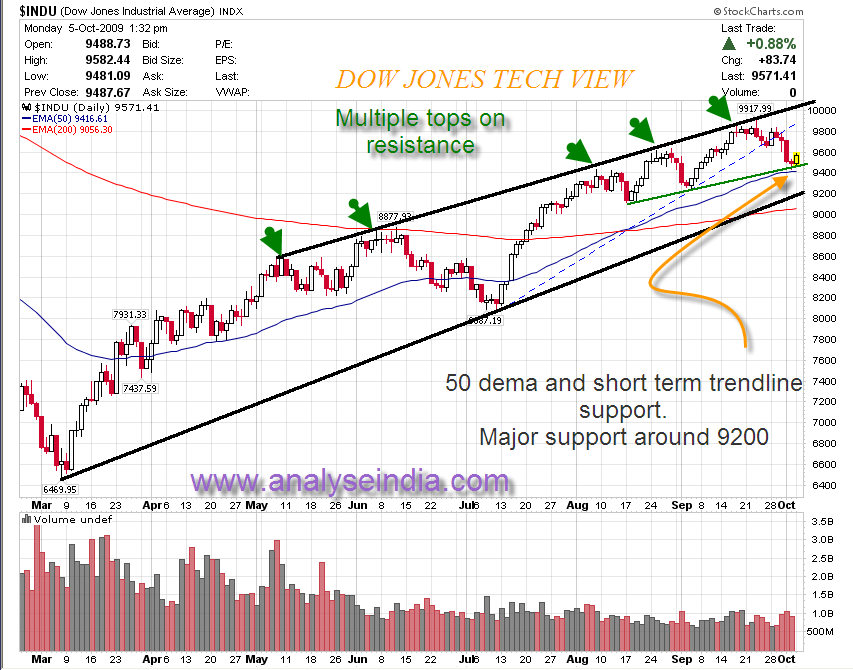
In the earlier update had posted a few charts before
-- DOW CHART 2
Although we did see a small dip below 9650-9700 but could not breach trendline support at 9400 and 50 dema as seen in 2nd chart.
Currently the index is seeing resistance around previous top. It needs to be seen whether it can cross 9900-9950 and head to 10300 or takes a pullback. Chances are that it may pullback to 9700-9600 again before taking a short at 10k.
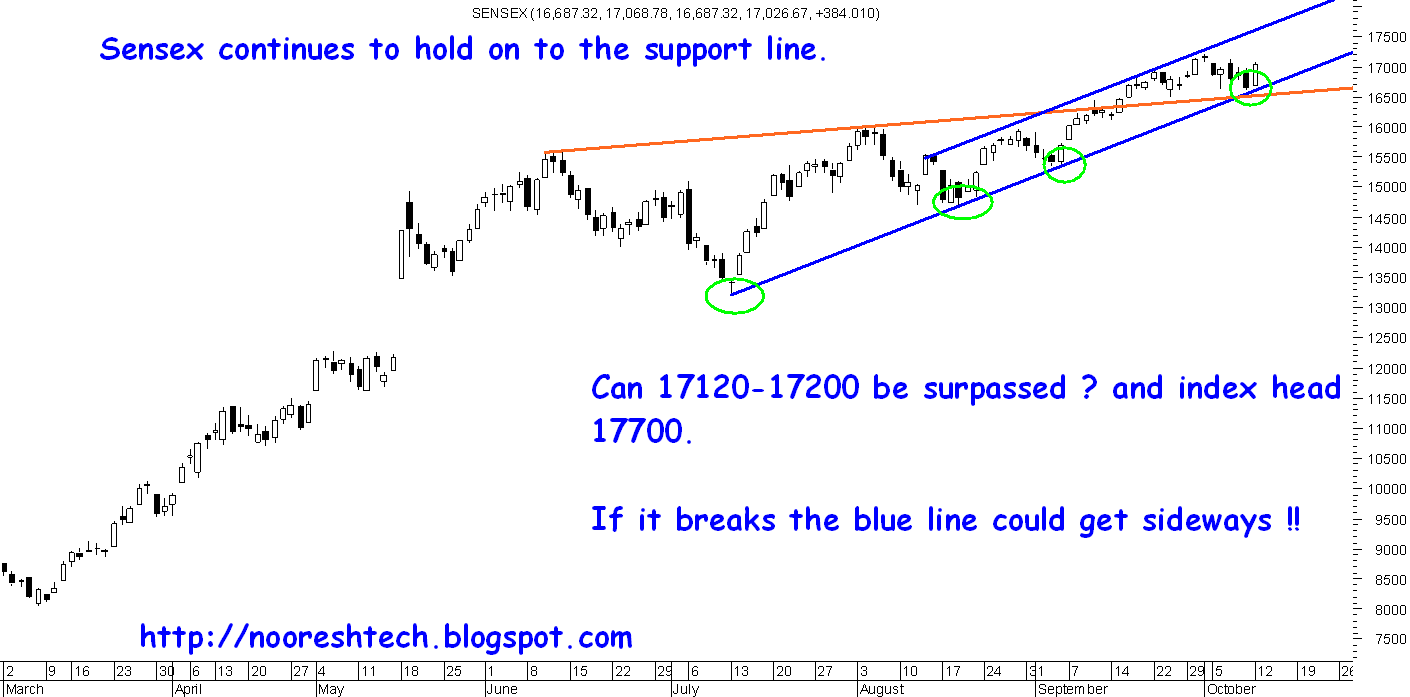 Sensex Technical View :
Earlier in the move from 8k to 15k we had a momentum trendline which did not break for a long time. Once it did the index gave a good dip and sideways movement.
Yet again index is making a support line which is not as steep as before. The momentum is definitely on the slower side.
But sharp bounces seen from the trendlines. Get cautious whenever the trendline breaks as this would imply a little dip and sideways movement before deciding the next move.
On the upside 17120-17200 a stiff resistance to cross which if done one can expect 17500/17700 or more in near term.
Downside we have seen two bottoms around 16606 and 16622. So a simple stop for longs is now 16550.
NEW ANNOUNCEMENT for day traders. :
For hardcore day traders add the id - analyseintra@yahoo.com for some momentum calls as trial. But yes please dont reply !!! just look into the messages.
Also people who would like to go for wealth management services for HNIs please mail to analyseindia@gmail.com or call 09819225396 ( after mkt hours - preferably 7.30-10.30 pm )
Best Regards,
Nooresh
09819225396