Sensex closing charts:
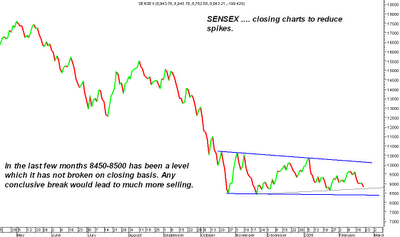
In the classical form of analysis by Charles Dow the preference was given to closing charts to reduce the spikes and noise but that leads to late signals. So now we have already been early into the selling part lets have a look on closing charts.
Sensex has not closed below 8450-8500 on downside and 10500-10700 on upside in the last few months. Sustained closing below those levels for a few sessions could lead to much more selling pressure.
Out in the triangle if we take it to be a closing based triangle then 8500 becomes a crucial point. But yes we still remain in a triangle breakdown on daily charts.
Sensex Technical View :
Sensex makes a low of 8762 very close to the trendline support of 8750 odd. Next support is around 8630 sustaining below which surely mean a breakdown and possible retest of 7700 -8300 also. Continue to remain on the short side but can expect some mild recovery if we dont close below 8500 in this week.
Regards,
Nooresh
09819225396 ( call after mkt hours for inquiries or queries )
noorrock2002@gmail.com meraninooresh@yahoo.com


