 Sensex extreme short term view :
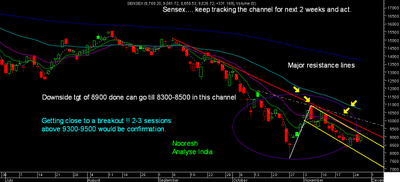
Sensex is inching towards the upper end of the flag . It needs to be seen whether it can close above 9300-9500 and give a fresh breakout which could tgt 9900/10500 or more ( channel line imp) . So wait and watch is the view for a move either beyond 8300 or 9300-9500.
Till then the trades should be extreme short term.
In the channel if we see it was followed for the last few rallies. On the same basis i expected a bounce back from 11k zones.
This is where the bottom picking strategy dint work and luckily we dint advise more then 50 % allocation and quite a lot of stocks gave an exit on bounce back to 10500 whereas some other bounce backs saved us.
Currently the last bounce got hit at the channel zone.
Only a re-entry and close above the channel would open a shot to 12500 zone which is a limit to any rally as of now. Only a close above this channel would give a long term turnaround.
In all the previous pullbacks/bear rallies have gone to the extent of 50/61 % before fizzling out into the next drop.
The current drop was very deep and a more then expected fall and so we have seen the rally fizzle at 38 % zone itself.
After that we have seen a 80 % retracement of the bear pullback.
In the next couple of months we have to see whether markets have the strength to retrace to the 50/61 % zone of 11650/12500 which would be the max limit to a bear rally.
Only a move out of such pattern and a higher top higher bottom on monthly charts would signal the end of the bear phase.
The long term flag or channel took place at 8k which we had spotted 2-3 yrs back.
The current correction has tested the channel /flag line which now remains an important bottom. Although in the worst of worst cases it can test the very long term line shown in chart below.
The dotted red line shows the long term trend change after which its been all about bear rallies and strong falls.
Blue Channels show the strong bull run.
Red Line shows the most long term line which may come to 6.2-7.5 k on diff time zones.
Light Blue Channel shows the consolidation pattern of 13 yrs.
As per fibo a long term corrective cycle should bottom out arnd 8-13-21 months. Preferred count is between 8-13 mths we are through 9 already. Next 3-5 months could be the end of the bear phase or find of a major bottom.
All the above views are purely technical and the levels are not very exact but a range which could give a good guide to next actions to be taken. Most of the views are based on long term and volatility would be high in the next 3-5 months but this would present very gr8 intermediate opportunities as well as be a very tough test for investors/traders.
Best Regards,
Nooresh
09819225396


