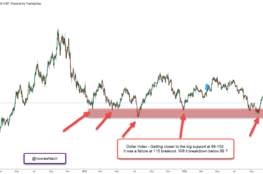
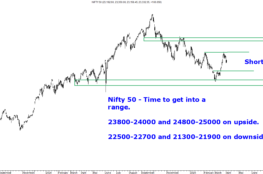
The above levels are the biggest debate between all types of technical analysts be it Elliot, Classical, Wave or whatever.
Although I am mainly stock specific so prefer to go with the Classical patterns but do tend to have a look into various theories for index calculations.
Now let’s see the points of debate based on primary assumptions of technical analysis.
1) Bullish or Bearish in the long term.
2) Historical Comparisons.
3) Time Period.
4) Price Target.
5) Miscellaneous Observations
6) Observations and Conclusions.
1) Bullish or Bearish
There is hardly any technical analysis theory or analyst who would give a 6k Sensex and 2k Nifty target and consider the indices to be in a major bear trend and we may not go above 21k in the coming decade and continue to be in a range of 6k-21k as we did in 1990-2000.
Majority of the technical theories and analysts continue to maintain that Sensex is in a long term bull market and may knock new highs in the next decade or say 3-5 years.
2) Historical Comparisons.
Let’s start with bear markets in India.
Although there is no hard and fast rule about what could be termed a bear markets. I would consider any fall of 20-50 % from peak in absolute terms and spans for more then 5 months to 2-3 years.
I have still not understood why every analyst thinks it was only 2000 to 2003 was the only bear market but that could be because all have been tracking Nifty only which started in 1994.
Sensex corrected 40 % in 1986 -1988, 1991, 1992-1993. The important one would be 1986-1988 and 1992-1993 as they lasted for more then 8-13 months and can be used for the comparisons.
Although if one is looking at a structural bull market then the most important one to be considered would be the 1986-1988 bear phase. As this goes well with the multi-year breakout which happened in 2005.
Comparing current bear market phase to 1992-1993 and 2000-2003 Sensex has one concern that during the period of 1990-2003 Sensex continued to range between 2k-6k. And all through after a bull run market ended up touching the lower side range of 2k. So in such a comparison it would imply a testing of the breakout of 6k in 2005 for current index and then make a new range of 6k-21k which may last for another decade ??? !.So definitely there are questions on both sides whether to consider 1992-1993 , 2000-2003 or consider the 1986-1988 corrections.
Charts for reference:
Sensex 1986-1988 correction
Sensex 1992-1993 correction
Sensex 2000-2003 correction.
USA – Dow Jones
This is the oldest available index in the world and also the biggest economy so it makes sense to compare a highly mature market for any part of technical analysis.
Here again the structural bull runs were seen in 1930s and 1980s. So 1937-1942 and 1987 would be important ones to watch for comparison as these corrections led to the major bull rallies. I have been comparing the US economic scenario of 1980s to India of 2000s. And the pattern of multi-year breakout seems to be very similar on both cases. Have extensively included the same in our come look into the future presentation.
Also one more observation is that October is a Bear Killer month for Dow Jones. According to the Stock Traders Almanac (which is the authority on seasonal trends), October crashes took place during 1929 and 1987. October downturns also took place in 1978, 1979, 1989, and 1997. October, however, is also known as a "bear killer". Bear markets ended during October in 1946, 1957, 1960, 1962, 1966, 1974, 1987, 1990, 1998, 2001, and 2002. Charts 2, 3, and 4 show October bottoms in 1987, 1998, and 2002. October also saw big gains after bad Septembers in the five years from 1999-2003. We have to consider October month importantly as US backed recession is leading to financial crisis all over the world.
3) Time Period.
This is the most difficult part of analysis and nothing can be termed to be accurate. But Classical and Elliot wave analysis do prefer a correction span of 8/13/21/34 months.
Now for Sensex there are mainly two camps which believe either the correction span ends in October 8 months or February/March 09 or the other one being the correction span goes well into Oct 09 or Nov 2010.
If 11k/12.5k is supposed to be a bottom then end of 2009 could see the new rally commence. This theory lays mainly a comparison to 1987, 1992 bear phase.
If 9500 or lower has to come in Sensex then yes the focus may shift to a correction span of 21 /34 months and the new rally to commence in 2011. This theory lays mainly a comparison to the 2000-2003 bear phase.
Although it is very difficult to give a time analysis for markets and economies but this is an attempt which many of the theories may point out too.
I personally would prefer and give a very high probability to the 1st theory of 11k/12.5k and 2009 mid to end to be start of the next rally as this has been the standard view since last few months about an economic peak and market bottom close to Sept/Oct 2008 which I have been repeating since 18-16k levels few months back.
The major turning point for the theorists would be Jan-March 09 or roundabouts where a different viewpoint me emerge either in favor of 2009 mid to end or end of 2010 or start of 2011.
Chart put up some time back comparing current bear market-
4) Price Targets.
Yet again we get into two camps out here.
One which prefers 11900/3600 or a bottom very close to it as this would be a retracement of 50 % of the entire rally from 3k to 21k or 850 to 6350.
The other one prefers a correction to 9700/2950 or a bottom very close to it as this would be a retracement of 61 % of the entire rally from 3k to 21k or 850 to 6350.
Classically markets would tend to correct to 50/61 % levels before commencing for the new rally. Also for Sensex the multi-year flag pattern breakout and channel has a support line close to 9500 till then the long-term multi year run continues to remain in place but a comparison with Dow Jones suggests that markets may not touch the support line at 9500 but can marginally dip below the 50 % level of 11900 before gaining strength for the next bull run which should be bigger then the previous one in time and magnitude.
Now other calculations in Elliot wave counting says either in the short run we are in C3 sub wave or C5 sub wave of the final leg of C wave correction. The counts may different with different analyst and different index be it Sensex /Nifty. Also I am not that adept with Elliot but there are not many counts which people have made on the super cycle of 1979 to 2008 but majority of the counts done are for 2000 to 2008 so maybe there could be different counts or views in both cases. But as per my calculations even if C5 goes to 9700 or roundabouts there is the major super-cycle which may continue well towards newer, newer highs in this decade or next 3-5 years as Sensex has broken out of a 13 year consolidation period from 1992 to 2005. This 2nd phase of the Bull Run should last for much longer time and much bigger targets which may be in times from the lows made!
In either cases one would expect a minimum target of 1.618 times the downmove in coming months/years which may depend on the bottom.
1) Miscellanous Observations.
One of the most important consideration is Sensex has broken out of a 13 year channel which is very similar to the Dow Jones breakout in 1980s. And the 1987 crash bought the Dow Jones index by 41 % and 57 % retracement. But it did not touch the lower end of the channel. For Sensex the lower end of the channel comes to 9500-10k on log charts. So ideally Sensex can worst come down to 9500-10k but generally in a multi-year flag breakout doesn’t come down to test the flag but retraces from much above the line.
The charts have been attached for the same comparison.
Flag Charts -
Dow Jones Flag
1) Observations and Conclusions
After a brief analysis of both camps there is one thing common which prevails is that even if there is a bigger leg coming towards 9700 we should see a 20 % bounce back from the lows near 11200/11500/11900 which will give good returns.
Also for the time period of the bear market the two camps consider it to be either 8-13 months or 21/34 months. So the most crucial time would be around Feb/March or till May when analysts and market may come to a consensus. So starting 3-5 months of 2009 would be a clear decider for investors/traders to take a more comfortable call.
It still doesn’t seem there is a consensus on a 9700/11900 or 3600/2950 price target and the bear market phase time period. But one thing that remains for sure is that majority of theorists on both the camps tend to agree on the next bull run which may either start at 2009 mid or end or start of 2011 or end of 2010.
All in all the next 6 months from Sept to March could create excellent investment opportunities for long term investors with a time frame of 1-3 yrs as with lower index levels lot many stocks may come to highly undervalued levels. So ideal advice would be to go staggered at every dip below 13k.
Best Regards,
Nooresh
09819225396
noorrock2002@gmail.com meraninooresh@yahoo.com
Its better to pay a fractional % ge of ur investment for a little professional and disciplined approach to investing and trading to generate gains with lesse risk then erode the portfolio without any help or rather learn the process of technical analysis and be independent in your decisions . We can help you in both of it by stock specific advice or training course . Check https://analyseindia.blogspot.com/ for more details or mail to noorrock2002@gmail.com .


