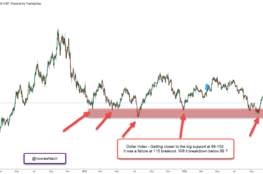
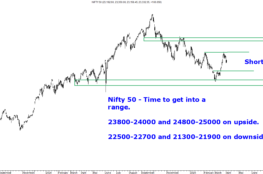
Before delving into the current chart people can have a look into the chart presented in our presentation come look into the future and also posted some days back. We are now into the purple zone.
Technical Views ////
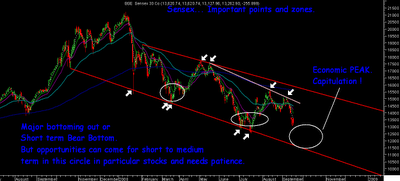
If we see the chart above 2 major things have been shown is the supporting trendline of the down channel and important points.
1) There are two sets of views of different technical analysts or fundamental analysts.One which considers the equity or India story to be over and we could well be headed to 6k-9k levels in the future. The another set has the view that India/equities go through this phase of trouble and pain sustaining above the 11-12k mark an embark into a new move in later part of 2009. There could be different theories analysis to explain the views and both may seem to be right ! . But common thing is in both the views investors/traders will get good opportunities if they are able to time their moves. I remain on the second set view which says we will sail through but with pains and patience.
Although a longer term scenario may be difficult to gauge as an investor /trader one needs to find opportunities and make full use of it . Coz in Bear markets the Bear rallies have moves which can be much more profitable in the short term compared to the smooth bull markets only thing is one needs to time them better.
Sensex Chart Explained :
In the above chart we have used two main things the channel and trendlines alongwith the important points symbolized.
If one sees closely the markets Sensex has continously followed the lower top lower bottom bear channel but has seen good bounces from the lower end and good falls from the upper end. The oval symbols shows the zone of support and panic levels on lower side.
Technically we are in the last leg of the bear market which can be highly painfull in terms of sentiments and price as the recovery period after the capitulation is decently long. In either case of a prolonged bear market it would see Huge Bear Rallies which can be extremely profitable.
Now in terms of levels 13100 was the first level to watch which we can assume to have been taken out. Below this 12800 zone if broken could lead to a new low !. On the lower side the pain could last from Septemeber to Mid-Oct ( although i was expecting a fall to come around last week of September ) .
The lower channel support comes around 11500 zone . On a longer term basis the 50 % correction level ( for 2.6k to 21k ) comes to around 11900. So if 12500 is taken of convincingly and a further panic or drifting move should find a bottom around 11900/11500. Investors who have already taken positions at 13100 can wait for 11900-12500 zone to add and traders could follow the levels to take trades accordingly.
Although 13100/12500/11900 and a worse area for current fall 11500 are important levels all of which may not necessarily be seen . So investors with a long term view those who did use our staggered buying approach at 14k-12.5k and sell at 15k + can now again follow the same process with discipline . no hurry and patience.
Although not all investors would have that much patience or courage to go out staggered in the rough weather right now but all of them should look to buy if 11900-12500 zone comes in. Pick quality large caps and solid mid caps with good track record !!!. Investing a serious business so do your research check your risks and apetite !!
We would see sectoral stocks later on coming days .
HAPPY INVESTING !!!!!!!!!
Best Regards,
Nooresh
09819225396


