Sensex Technical View :
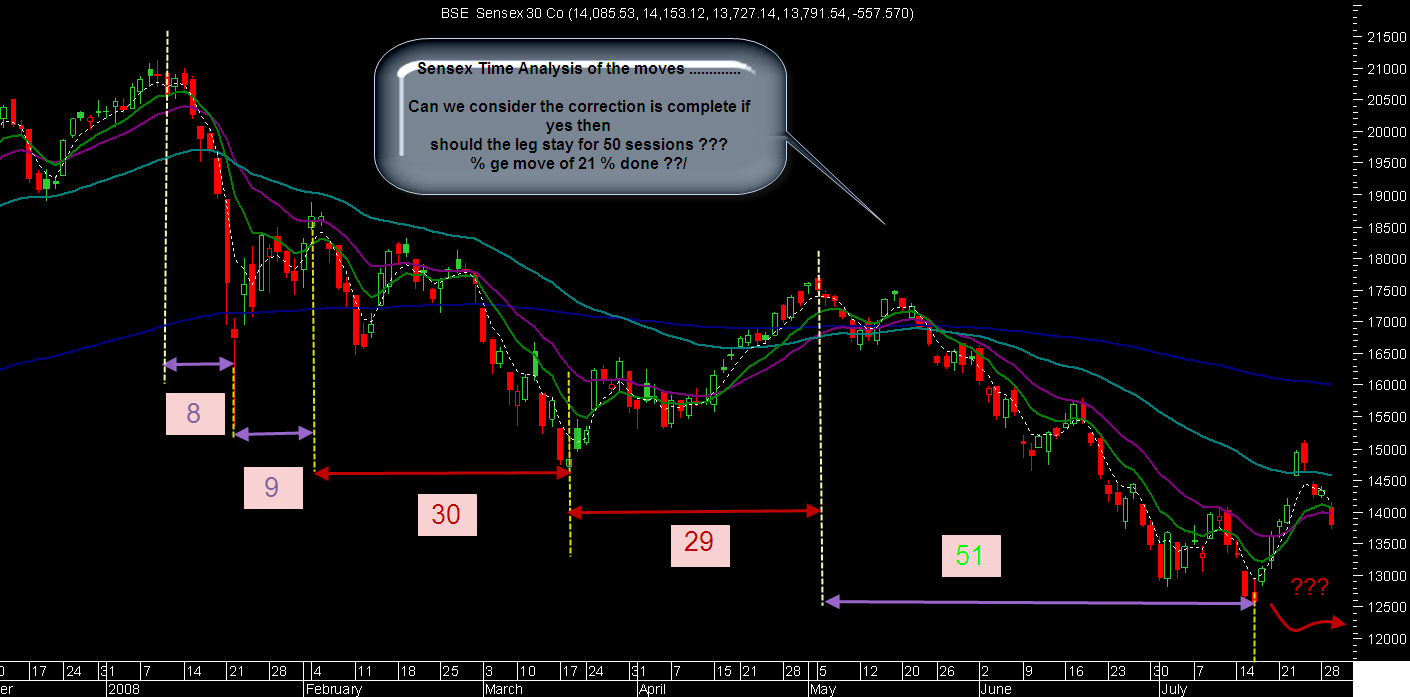
TIME ANALYSIS CHART
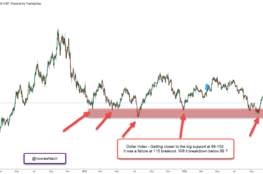
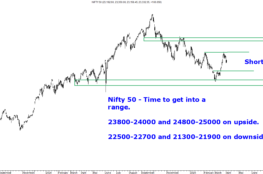
PRICE ANALYSIS CHART
Sensex still not able to clear 15100 or break below 14400 this is where it stands and till it doesnt give a clear indication the range could remain for some time. There is one gap at 14600 which needs to be filled and supports at 14400/14000/13700 . On upside above 15100 Sensex can see 15580/15800 and to an outer extent 16400.
Review of the time analysis and price analysis chart :
As shown in the chart before and also discussed before that around 4-6 weeks back that it could remain sluggish for quite some time around 50 sessions or more starting from the low of 12500. We are already through 35 odd sessions and another 3 -4 weeks after we need to get watchful which is Sept last week or lateron. On the price analysis chart the percentage move relation shows 15500 as an important tgt which is already done. Technical resistances are placed at 15800/16400.
Market Observations and Thoughts :
Resurgere Minerals is below 300 after knocking 700 + . Anything unusual no ! just another newlisting punter move cleared. On the listing day itself it was mentioned to take care and if trading then take the moolah and forget . Hope traders dint get trapped ! ... It has no value at 300- 350 also !! fundamentally .
CRUDE 102 almost . Consistently mentioned the bull story is over sicne 140 $ . Short term support is at 98-100 from where it should see a bounce coz next important zone is at 88-85.Gold also 780 is a crucial level if sustains below could well head to 725.
Stocks to watchout for :
Sterlite Technologies has given a breakout and sustaining above 200 could tgt 225 in near term.
IFCI has seen increased volumes and buying interest . Can tgt 53 in short term can keep a stop of 45-46 .
Some thoughts :
Yet another logical and mathematical fiction which actually needs lots of calculations which some economist may come out in the future with a detailed report on .
I have taken a simplistic view !! whereas its one of the complicated calculations. If there is something wrong people can please bring it to my notice.
INFLATION :
In simpler words Inflation rate is the % rise in prices corresponding to the same week in previous year.
Lets see a simple example of how this calculation works .
First an index is taken by giving different weightage to different commodities etc.
Simple example with Base effect implications :
Week1 - 07= 200
Week2 -07= 195
Week1- 08 = 224
Inflation Week1- 08 = 224-200 / 200 = 12 % .
Week2- 08 =224
Inflation Week2-08= 224-195/195 = 14.87 % .
This in turn leads to a higher spurt in inflation even though when the Index has not moved.
Now taking the next scenario.
Week1-08 = 224.
Week2-08= 228.
Week1-09 = 250.
Inflation = 11.61 %
Week2-09 = 250.
Inflation = 9.65 % .
This scenario will lead to a quick drop in inflation although when the index doesnt fall.
NOW WHY ARE WE DISCUSSING SUCH Mathematics and calculations. Lets c why.
For last many months we have seen inflation zoom away coz of the price moves in commodities which was also accentuated by the lower base last year. Also crude oil impact lead to the next jump in inflation. This impact of lower base can stay for another couple of weeks or months is a guess.
Now in the current period of 8-13 % inflation in the period of March - September or even later it may happen that its creating a higher base for the INDEX.
So in the mid of next year onwards this impact could slowly start coming into play if prices just remain stable !!!!. Also if commodities and index constituents take a good drop inflation could also plummet quickly. !!! Also lot of monetary actions are being taken and Rupee is at lows a bounce in it in coming months could also effect.
One needs to see exact values for particular periods to know about which periods would see major impacts.
If possible will try to gather exact data and calculate which would be a difficult task but the simple mathematical logic seems much more easier n effective although how big an impact it can be needs calculation.
Well as a matter of fact such a BASE effect in Year on Year results may also make lot of results next year to be more better then they are.
Example:
Q2- 07 - profits = 100 crores
Q2-08 profits = 60 crores.
Drop of 40 % in profits Q-o-Q .
Q2-09 profits = 90 crores .
Q-0-Q growth now is 50 % . Which would still be lower then the best times of 100 crores.
Some thought : Was just thinking of keeping a investor/trader meet in Mumbai for all readers/friends/investors etc where we may discuss about technicals , need of it , market view , investment and trading strategies etc. If people have some ideas or way to go about can mail to noorrock2002@gmail.com so we can plan something out.
TECHNICAL ANALYSIS SESSION MUMBAI :
SEPT 20-21
Interested people can get in touch for more information, confirmations and queries . Nooresh 09819225396 , noorrock2002@gmail.com .
Best Regards,
Nooresh
09819225396