Dow Jones :
Short Term View :
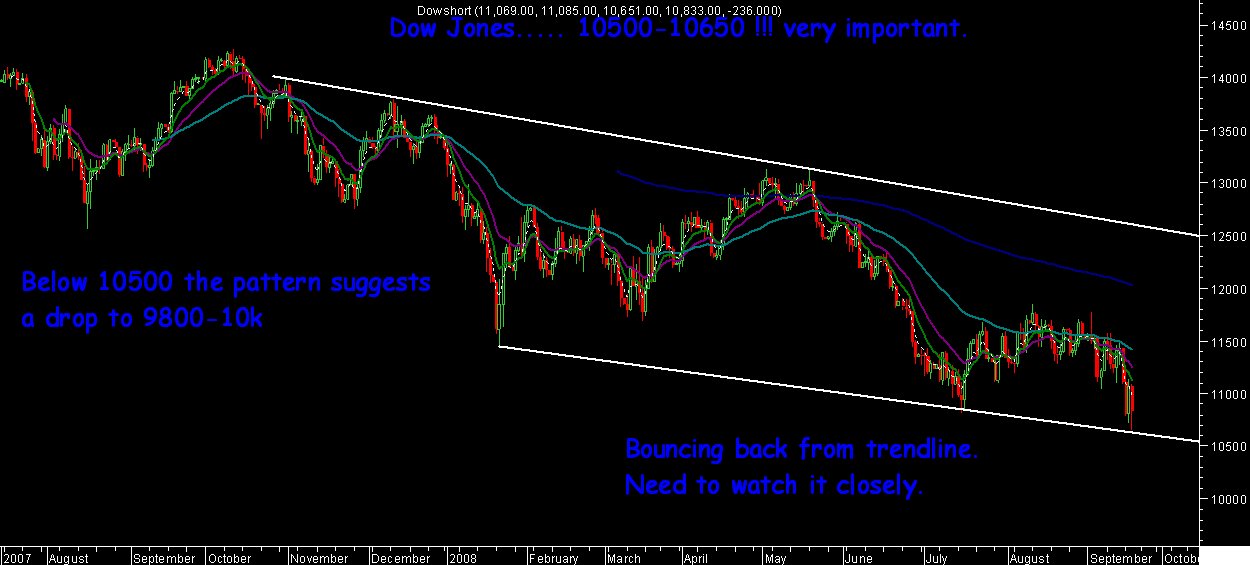
In extreme short term the chart seems to be forming a weak pattern which can also be a inverted cup and handle pattern. Confirmation would be a break below 10500 which could lead to 10000/9800 and 9500 in worst case. But one thing to note is the support comes around 10600 zone which if it does hold could lead to a bounce also. Technically one needs to watch the 10500-10650 levels closely.
Long term View :
If we see the long term charts
1) Dow Jones moved from 7181 to 14280 levels from 2002 to 2008. The current downslide should correct to 50/61 % of the entire rally . And on a very long term basis if we take from 1980s it should correct to 38 % of it.
2) In the last dip it made a low around 10700-10800 which was very close to the 50 % correction level.
3) The next dip should take it to the 61 % correction level which comes to 9800-10000 zone. And for the very long basis 38 % comes around 9500 .
So in the bear scenario it is in the index could well settle out closer to 9800 +- 200 points.
This is just a technical view , not considering the ecconomic or fundamental scenario. Although for last few months my expectation has been September would be the month where economic data could Peak out.
Best Regards,
Nooresh
09819225396