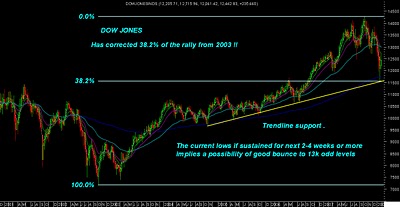
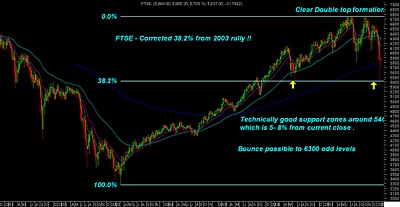
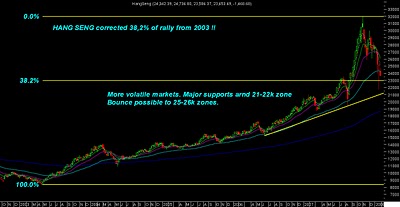
Above all the major world indices have been covered . FTSE from europe , Dow Jones US , Hang Seng from Asia . Weekly charts as per closing of 30 th Jan
Some observations Technically :
One common thing observed in all the world indices is all of them have corrected to 38.2% of the rally starting from 2003 onwards.
The indices have bounced back around 50% of the dip starting frm jan crash and are now consolidating in a sideways zone.
Technically considering the current lows as panic bottoms and supports there is a high possibility of a rebound to higher levels as we are into highly oversold zones as markets have corrected too quickly.
Wait for a good consolidation near to previous bottoms and look for reversal signals to start buying. It would be a lil dicy to say whether we can resume a new bull trend and head to newer highs . But even if the markets have to go into a longer downtrend we need rebound rallies to higher levels ( as stated in the charts ) ideally before we start to looking ahead .
Fundamentally we are at a crucial juncture as a lot of global economics is uncertain in teerms of recession etc and historically markets react negatively to unceertainty. All the previous recessions or big falls in last few decades have been of similar magnitudes almost 25-30 % from peak levels namely. All the recessions and global sell offs can turn out to be the best possible return scenario for investment. Only thing to see is are we near to the end of current credit squeeze or setting up for a much longer puzzle being made.
But all these does not rule out a good technical rebound in global indices like india, hang seng , dow etc in next couple of months before the world decides what is in store for the end of the year a reversal of a weak economic recession or forming of a bigger sub prime or other problem which i cant understand .
For India closing below 16500 for more then 3 weeks would imply something is wrong fundamentally or economically which i cant UNderstand as i dont see companies showing bad results or problems and the Indian growth still remains the strongest . As technically staying below it for a long time needs a review of our long term bull trend view which we gave at 8k levels .
check this picture out simple but clear  ./.............. https://www.portfolioanalysis.biz/cycle.gif
 ./.............. https://www.portfolioanalysis.biz/cycle.gif
 Sensex Technical View :
As maintained before investment buying should be initiated at close to 17200 support levels . Resistances on upside at 18800 -19000 zone. Sensex is still in a consolidation zone between 16-18 k levels .
TECHNICAL ANALYSIS SESSION MUMBAI FEB 9-10 .
Best regards,
Nooresh
09819225396

