
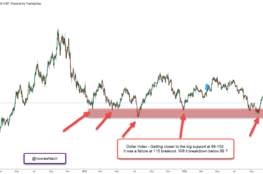
Gold --- Long term uptrend is under threat.
A more detailed article posted on www.analyseindia.com Check link here
https://www.analyseindia.com/analyseindia/readPost.jsp?postid=132
Gold --- Long term uptrend is under threat.
A more detailed article posted on www.analyseindia.com Check link here
https://www.analyseindia.com/analyseindia/readPost.jsp?postid=132
This site uses Akismet to reduce spam. Learn how your comment data is processed.
December 14, 2011
basically .. gold chart is varying according to currency u take as base.. it $ term it may look weak .. but if u see re. wise u will feel it is bullish ..
and if gold has tgts of 1300 in $ terms means .. $ index has 88 tgt & equities will go down to 4000 nifty
December 19, 2011
Hi Vikas,
The commodities move in their own way. Dollar Index did nothing major last few months but nymex crude did fall to sub 80 levels.
So all the co-relations go for a toss. Better to stick with pure technicals on each of them.
Gold is giving signals of heading towards a major breakdown.
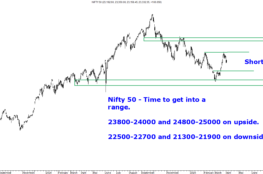
Nifty may or may not go to 4000 but majority of the stocks are already at similar levels.
December 20, 2011
Thanks for the reply nooresh .. ya my above comments were based past correlations which might or might not work .. gud call on gold .. hoping it soon reaches ur 2nd/3rd target too .. Keep the good work going ..
December 20, 2011
Yes vikas, Co-relations have been changing very swiftly nowadays 🙁
December 14, 2011
Gold broke the long term support of 1600.
December 14, 2011
Good call Nooresh bhai.
December 16, 2011
ur chart on Gold has been pasted at one other site
June 18, 2012
[…] multiplied many folds. In the last couple of weeks, gold prices have been extremely volatile and some analysts also predict that gold price upside movement is in threat. So I found gold prices for last 86 yrs (1925 – […]