CRUDE THE JOURNEY FROM 147 to 106 .
For so many years have been focussed on tracking equities and considering technicals do work sharply on them but in the last few months due to the effect of crude , gold , global cues setting up the sentiment have been tracking crude and giving my views.
Although i may not understand the fundamentals behind movement of crude prices ( are there any 😉 ) but what i have observed is the technical analysis we have been using on equity have been evenly accurate on Crude too.
Some of the big moves , tops , bottoms we picked up on crude which also was a base for some of our stock and index recommendations on indian equities.
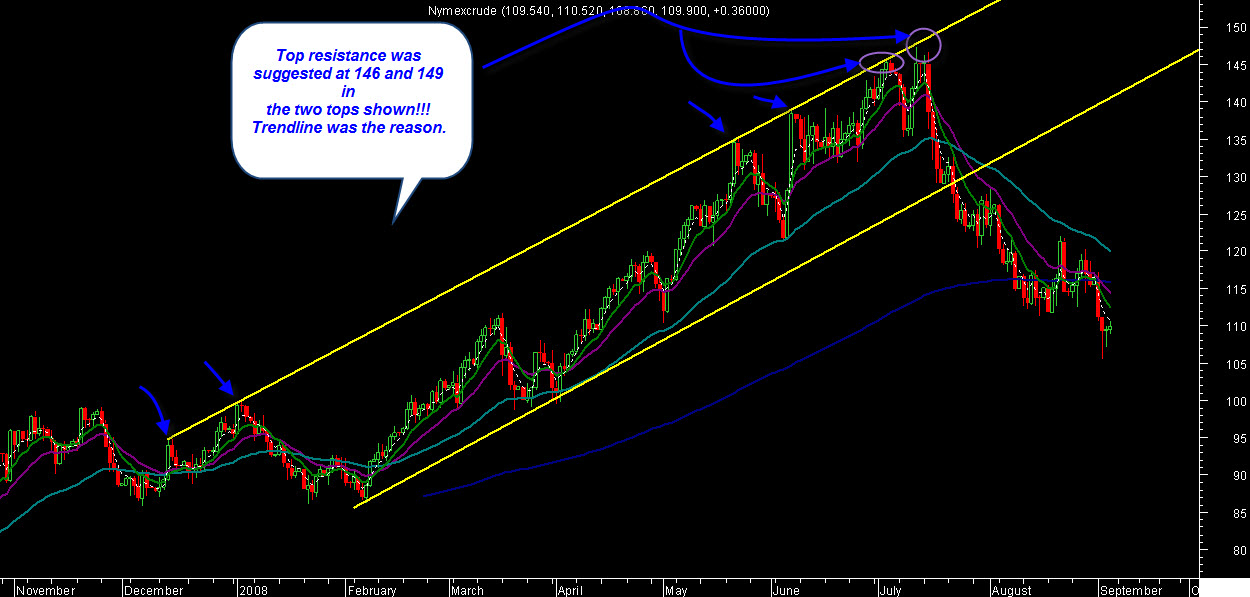
Top suggested at 146 . Saw a top around 145.8 . Rising wedge pattern !!!
Again top was suggested around 149 we saw a high of 147 odd.
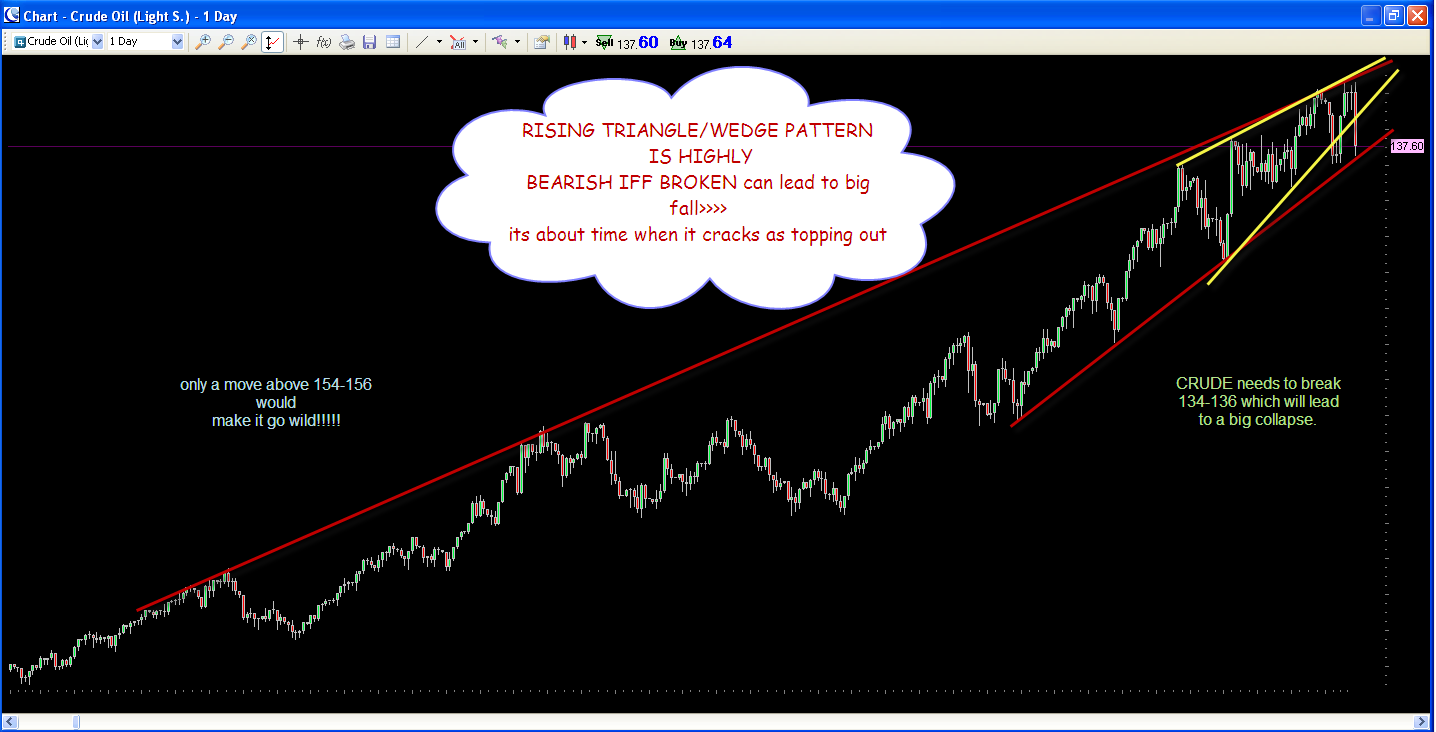
Within days of our view of a highly bearish pattern being made on crude and its about time it falls and below 134-136 could lead to big collapse , crude hit 120 non stop.
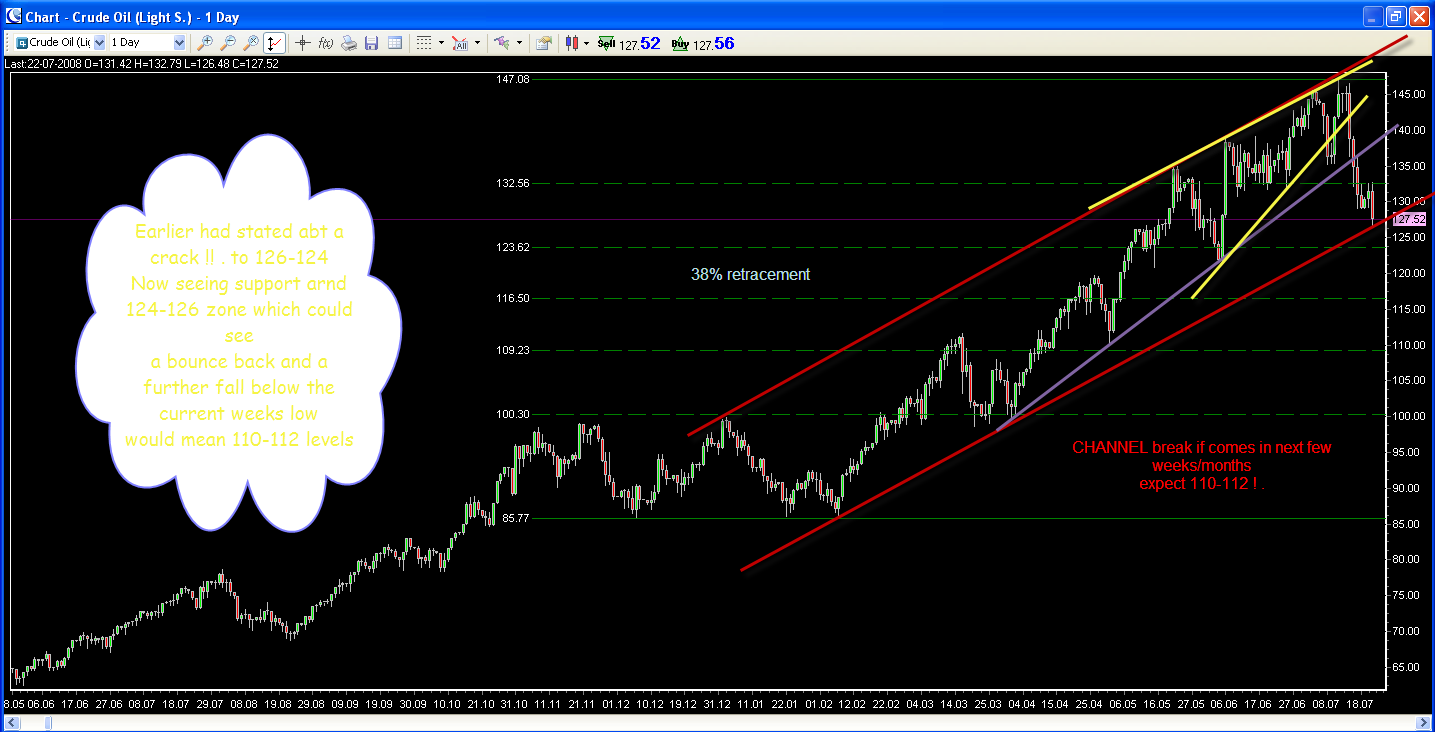
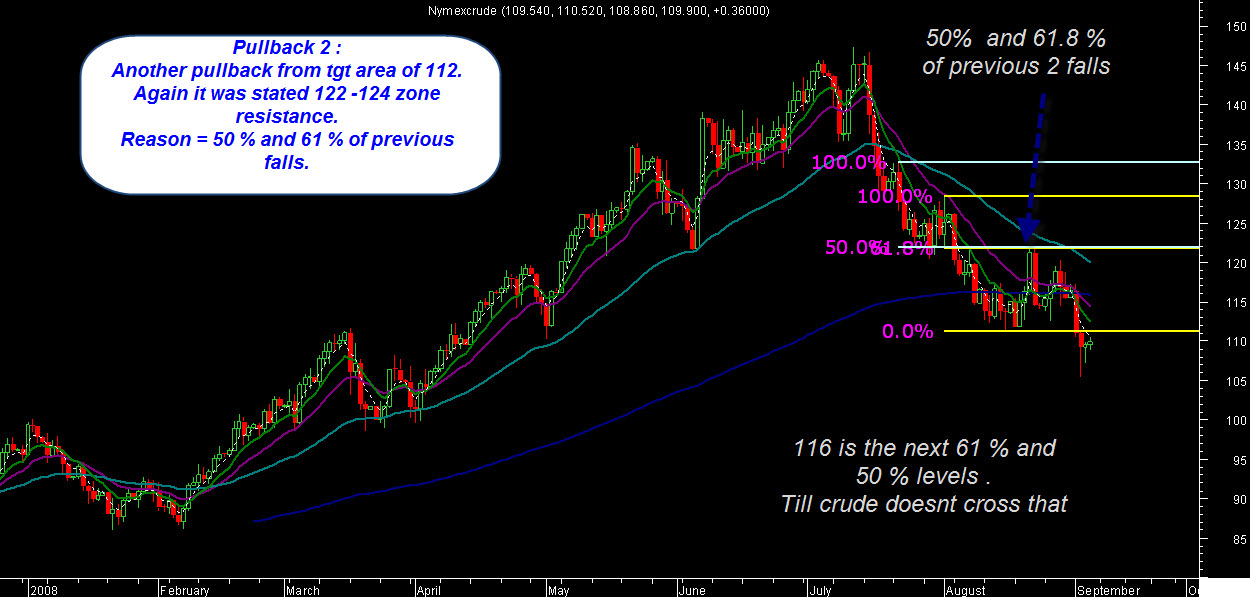
Later we saw a pullback and then break of the weekly lows to test our 112-110 tgt.
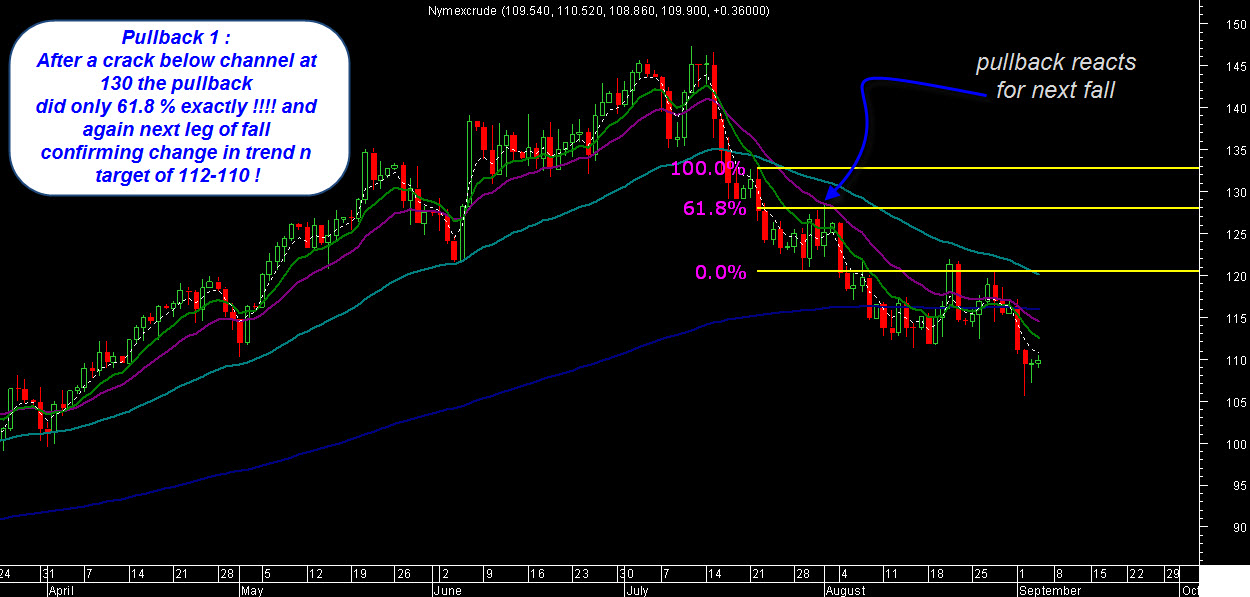
Again pullback to 122 ( zone was said as resistance ) and then almost achieving our tgt of 105 .
All the charts are in order of the views !!! Final chart has recent levels mentioned.
Good recap showing how useful technical analysis can be !!