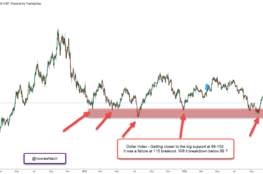
If you see the chart above is a imposition of VIX ( Volatility Index ) and Nifty.
In the last few weeks the markets have gone silent with markets not doing much and Volatility Index coming down to low levels. Ideally VIX should indicate what the market thinks and for now market thinks the Index is not going to make any spikes in near term.
But every time the VIX has come to such low levels there have been large 5-12% moves on the index. Although many of the analyst suggest that markets generally crack after a low VIX. But last time in the move from 5500 to 6300 it did the reverse.
So for now the simple indication is January is going to be an interesting month with a possibility of 5% move on Nifty or even more. My personal take is a breakout above 6050-6100. More clarity will come in start of January but the above chart clearly indicates the traders/investors should be alert !
ANALYSE INDIA announces the next 2 day exhaustive Technical Analysis training program in Mumbai on
January 8th and 9th
To register yourself call Kazim 09821237002 Asif 09833666151
Also keep reading www.analyseindia.com for more updates as well as checkout our performance reports.
Regards,
Nooresh
Team Analyse India