 For all the bull eyed people ...
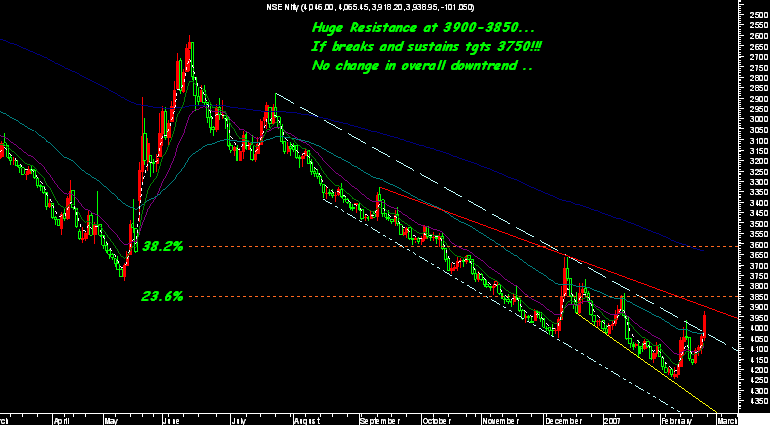
The above chart is an inverted form of nifty which makes it look like a highly bullish
if tries to break away from the current trend !!!
The trend reversal area is 3900-3850 ...
If we see the chart in a bullish manner we would wait for some confirmation for a trend change and not pounce on buying ...So get the analogy !!!!!
So from here if we break the trend it could be a big move !!!!!
Regards,
Nooresh
9819225396
noorrock2002@yahoo.com