The State of the Market.
- Dollar Index hits a new high. ( Euro below Parity )
- US indices retraces 60% of the recent move. Not far away from March lows.
- European Indices close to March-June lows.
- Commodities cool off. Brent back to 90s
- Russia-Ukraine Conflict was supposed to be days and turns to months.
- China-Taiwan , China covid etc.
There can be a lot of other things which can make us take focus away from finding trade and investment opportunities in India as well as Risk Management and Asset Allocation thumb rules.
We have now again started listening decoupling which last was heard in 2007.
This brings down to the question can India outperform in a tough global environment ?
Let us look for the answer from this chart which compares Dow Jones to Nifty.
1) Nifty to Dow Jones– Deja Vu 2005 ? Atmanirbhar Nifty ?

- The last time Nifty outperformed the Dow Jones was in 2005-2007 in a big way.
- A little bit of outperformance in 2009/2010 peak.
- Since 2009-2010 Nifty has underperformed the Dow for a decade.
- In Dollar terms the returns would look much more worse.
- First outperformance ticks in last few weeks. Ratio crosses 2014 highs.
- Looks like a Deja Vu 2005.
2) BSE Smallcap to Nifty

- We look at BSE Smallcap Index as its a very unique index. Represents the bottom 15% of Market Cap of India and has no upper limit to no of stocks.
- Over the last 10-15 years the Euphoric band is 1.9 or above. Below 1.1 is the pessimism zone.
- Right now for the last year or so remains sideways.
- No over-exuberance or euphoria on this paremeter.
3) Nifty 500 – No more a quick reversal. Consolidating at higher end.

- The last 3 reversals started with a few consecutive down candles and saw follow up.
- A recovery was feeble and did not hold for long.
- This time around the first reversal has not been quick and is holding higher.
- Showing more positive signs to previous periods.
4) Nifty CPSE

- The last time when PSU stocks did really well was in 2014 post elections.
- The expectations did not materialize.
- 2017 was with the market momentum.
- 2021 was been a good rally.
- 5-6 attempts done can it breakout in 2022-2023.
- Got to remember if you add dividends the chart looks very different. ( NTPC 2007 peak would be 200-230. Adjusted for div its an all time high.)
5) Nifty IT – Bench Time.

- Nifty IT saw a big change in outperformance after a decade in 2020-2021.
- Lead the move and now the whole outperformance has been neutralized.
- Time to Bench it out and watch this band 26000-30500. Get back to work on the sector when this band gives way
Do read this post
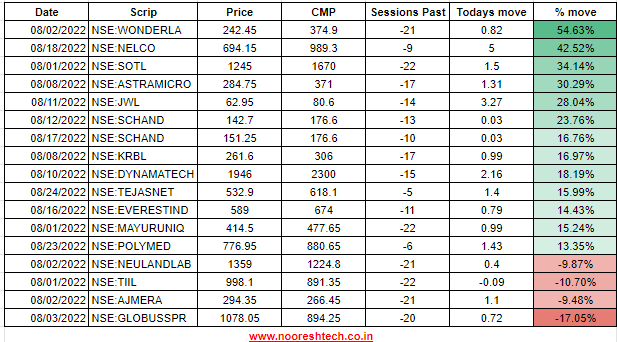
Technical Traders Room – The Hits and Misses – August 2022
TTR – Technical Traders Room is a paid broadcast service run by www.nooreshtech.co.in
In the charts below we have highlighted a few hits and misses for the month of Aug 2022
Please note we have posted more stock charts in the broadcast than covered below
We have covered only the best and the worst ones here
Link to service: https://bit.ly/3AA11Gg