Grab a coffee as it will be a very long post. Watch the charts minutely. Ask yourself the question where do we stand today, as you read the post!!
Market Kya Lagta Hai?
Let us see Market kya lagta hai based on RSI, Overall drawdowns of all companies from highs, Small cycles and some other data points
To understand it in an hour long video format, do see our coverage of below topic in the weekend webinar -
Get access it for Rs 500/- + taxes
View and Subscribe: https://bit.ly/3NbURRi
Topics covered in the video
Topics Covered - > What are moving averages > Using moving averages as stoploss > Moving average convergences > Convergence examples on Index > Convergence examples on Stocks
Market kya lagta hai? > RSI@30, what to expect? > Broader market drawdowns > Smallcap correction cycles and more > Rate hike cycle, P/E etc.
If you like reading, here we start
RSI@30 and RSI Divergence
If it’s a healthy correction, there is a possibility (will see with examples) of RSI bouncing from 30 odd levels.
Possibility 1) – Sharp bounce from 30 RSI
Possibility 2) – Small bounce from 30 RSI, followed by RSI Divergence & finally a sharp bounce
Current market scenario with some historical examples of RSI.
RSI 2008-2011
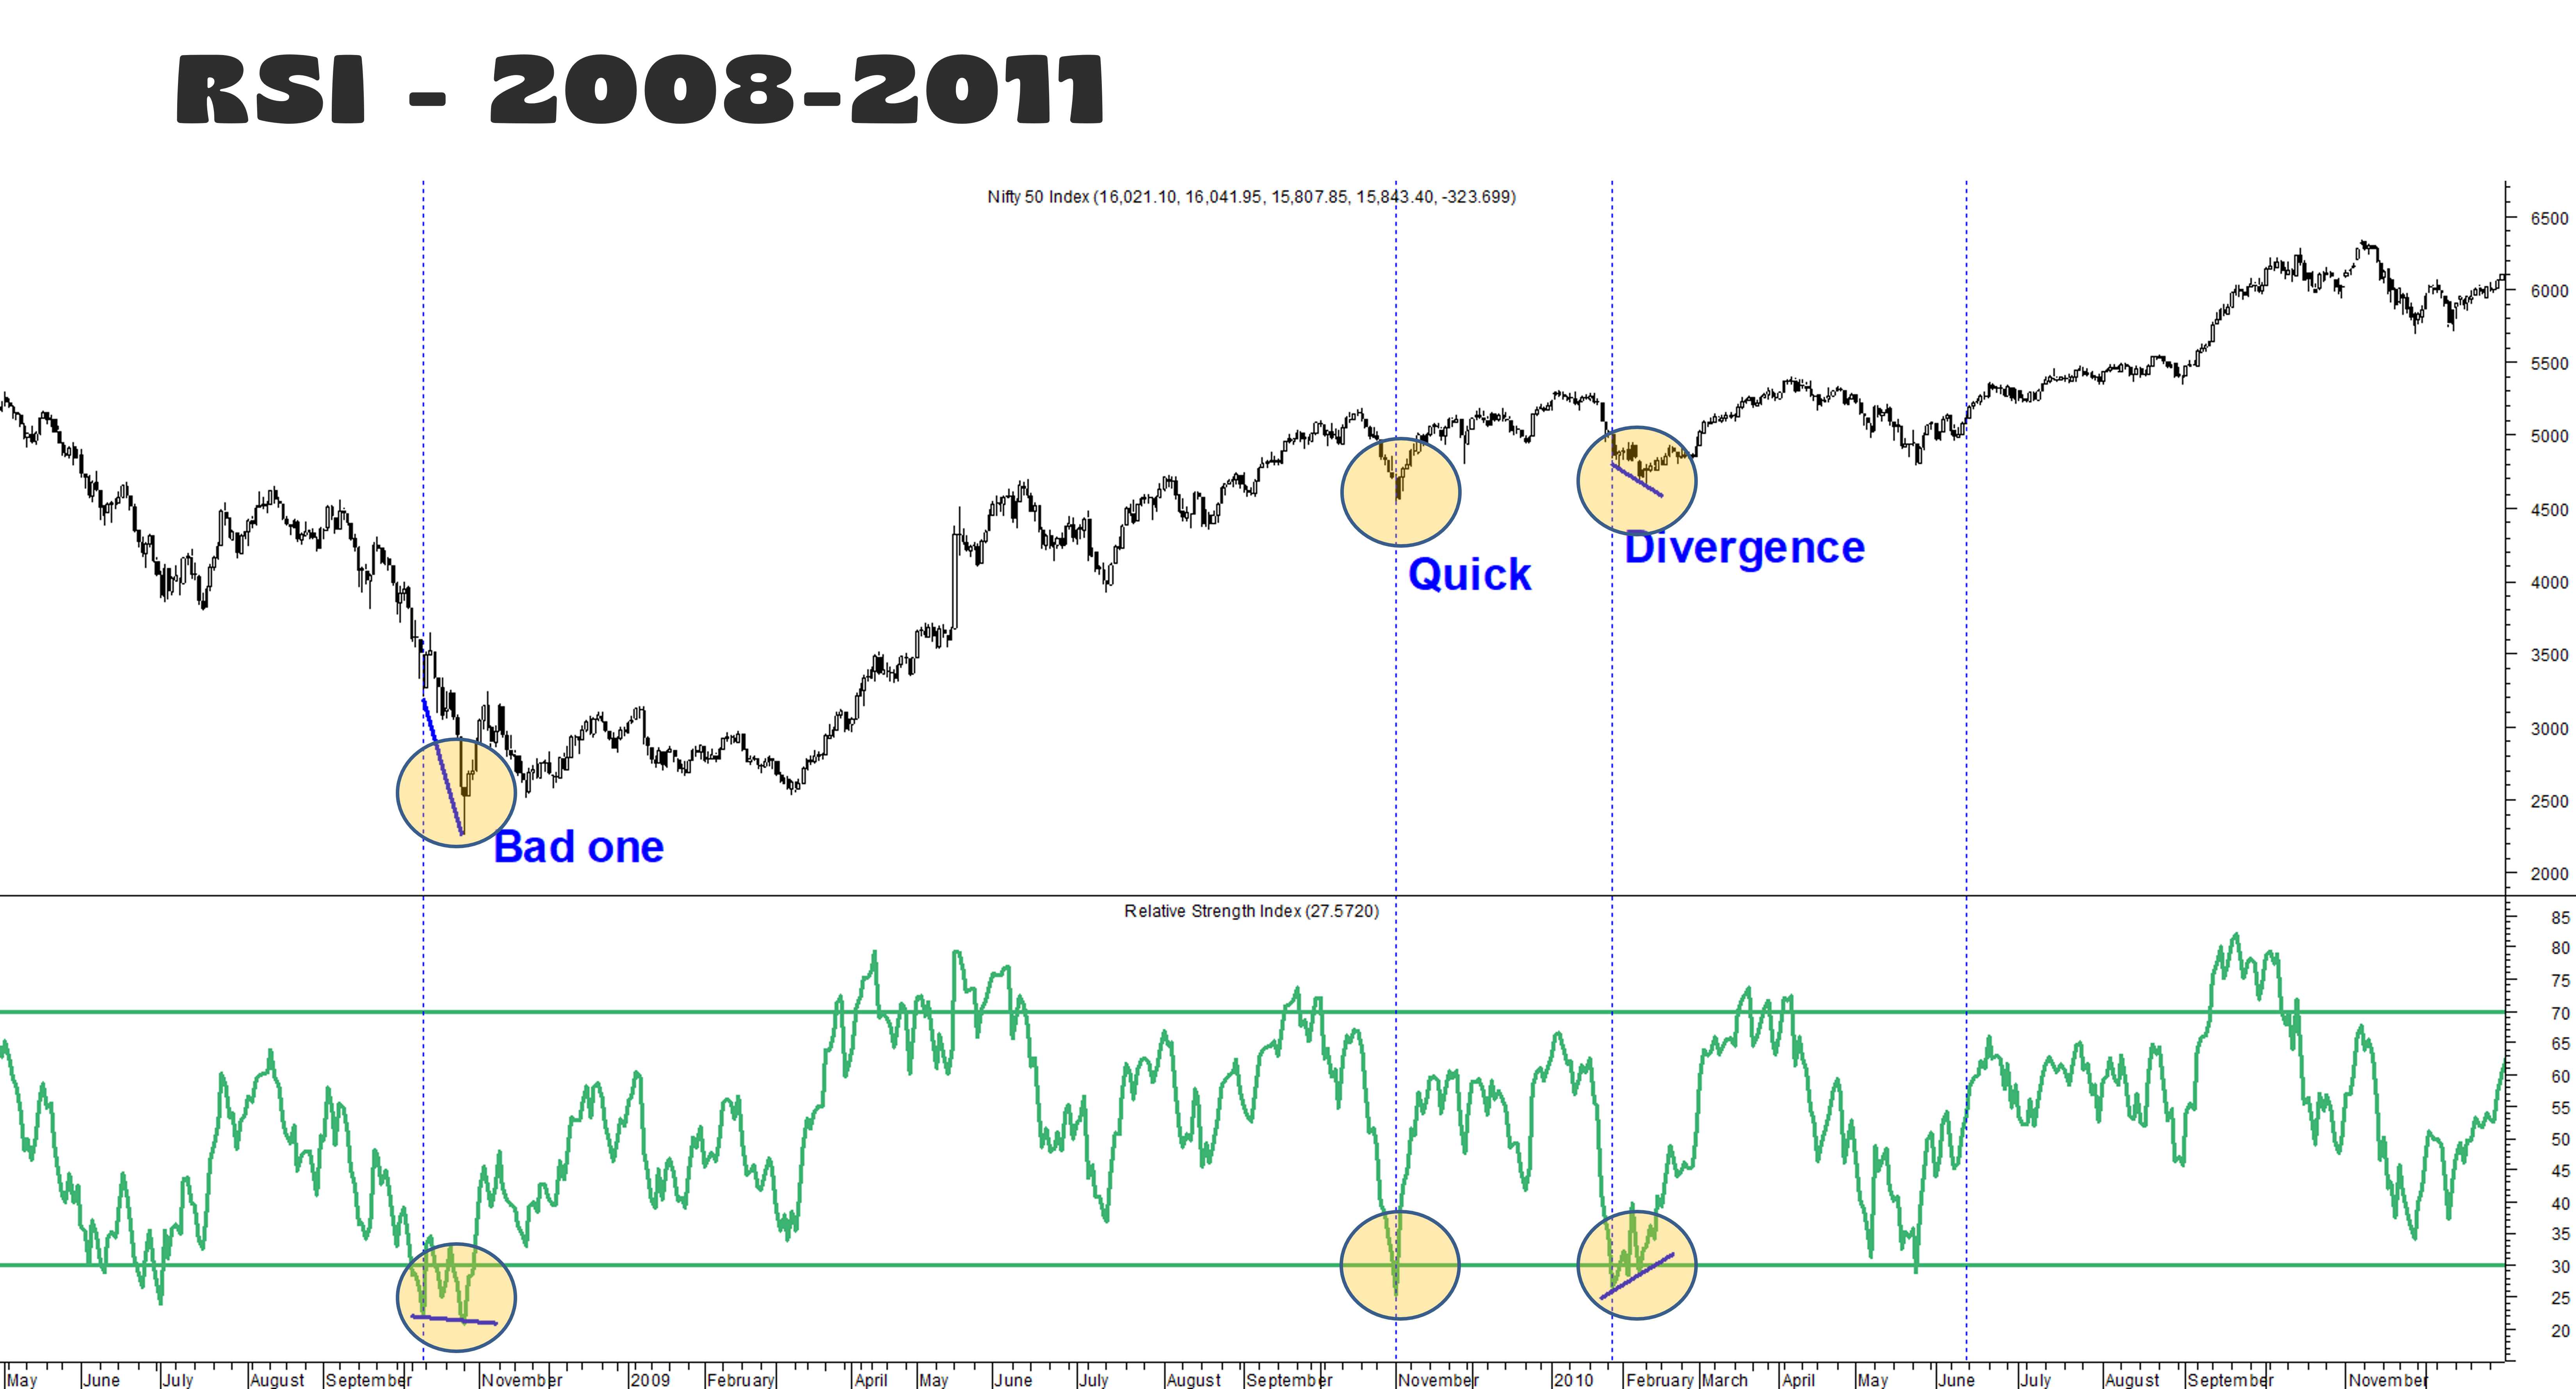
Ex 1) Failed one – RSI made a minor low, Nifty fell badly
Ex 2) Sharp bounce from 30 RSI
Ex 3) +ve divergence - Nifty making a lower low, RSI making a higher low, followed with a bounce
RSI 2011 to 2013
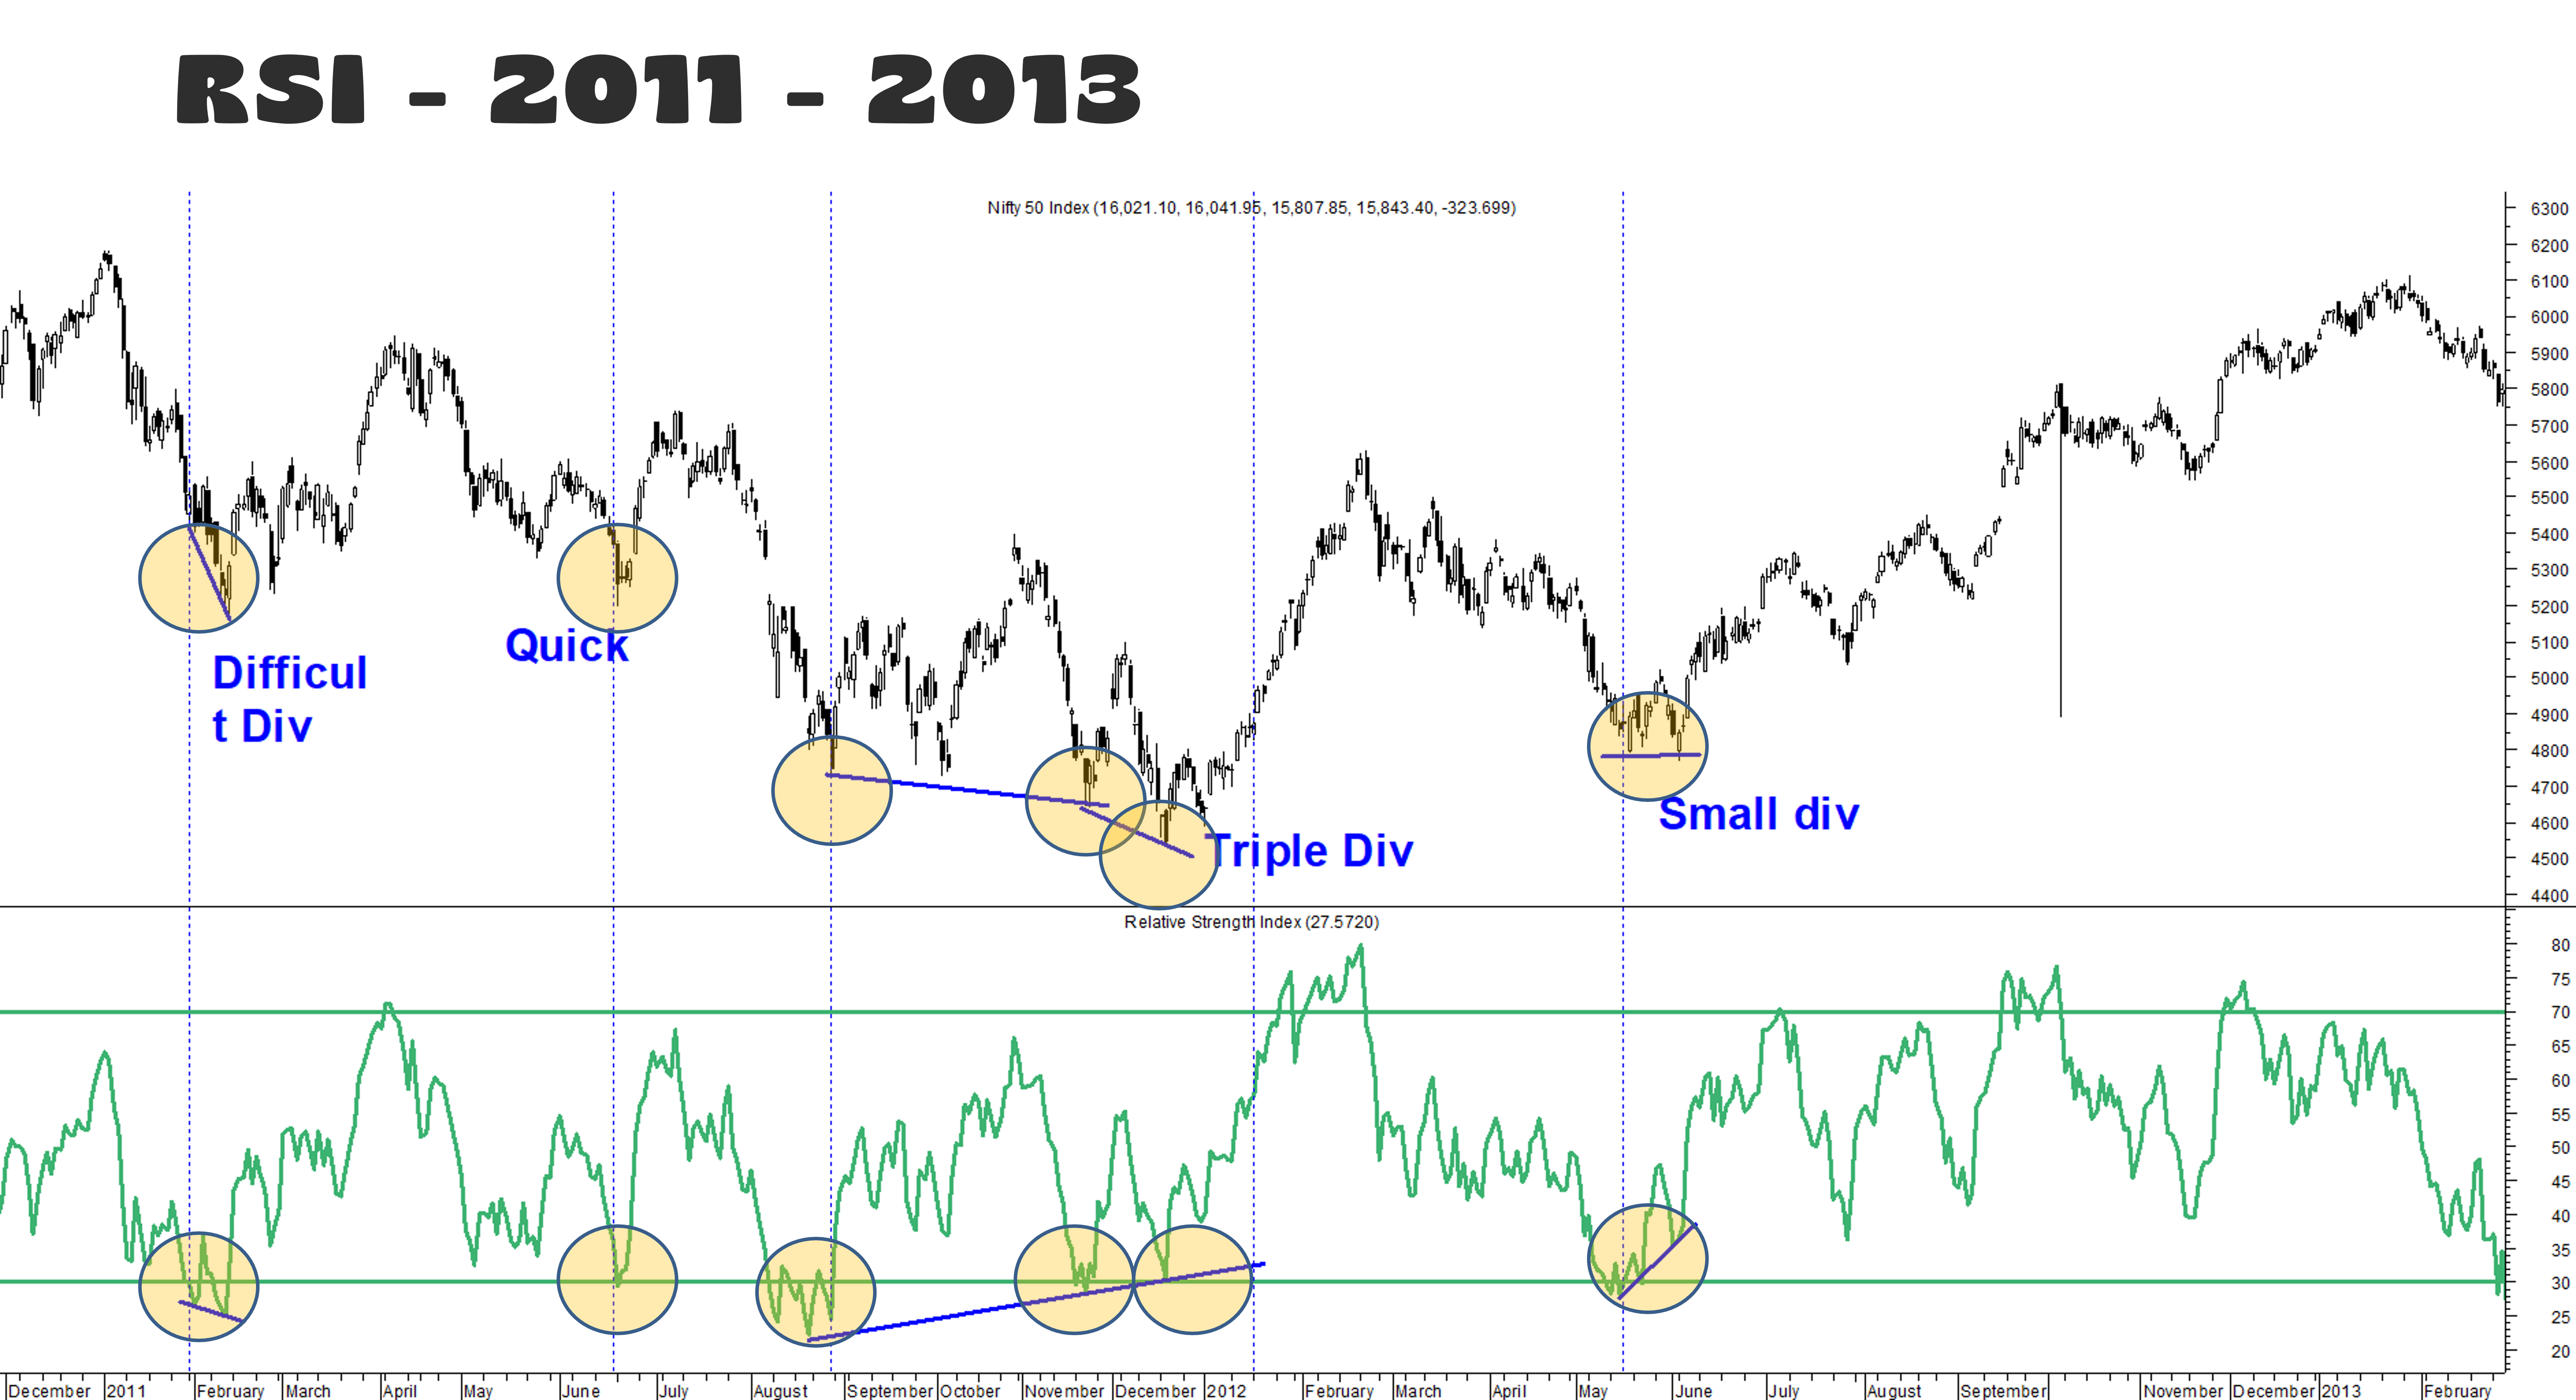
Ex 1) Difficult Divergence - RSI made a minor low, Nifty fell more (Hidden +ve divergence)
Ex 2) Sharp bounce from 30 RSI
Ex 3) Triple +ve divergence - Nifty making a lower low, RSI making a higher low, followed with a bounce. However, note it was a painful period in terms of time as it took 5-6 months to playout
Ex 4) +ve divergence - Nifty making a same low, RSI making a higher low, followed with a very good bounce
RSI 2013 to 2015
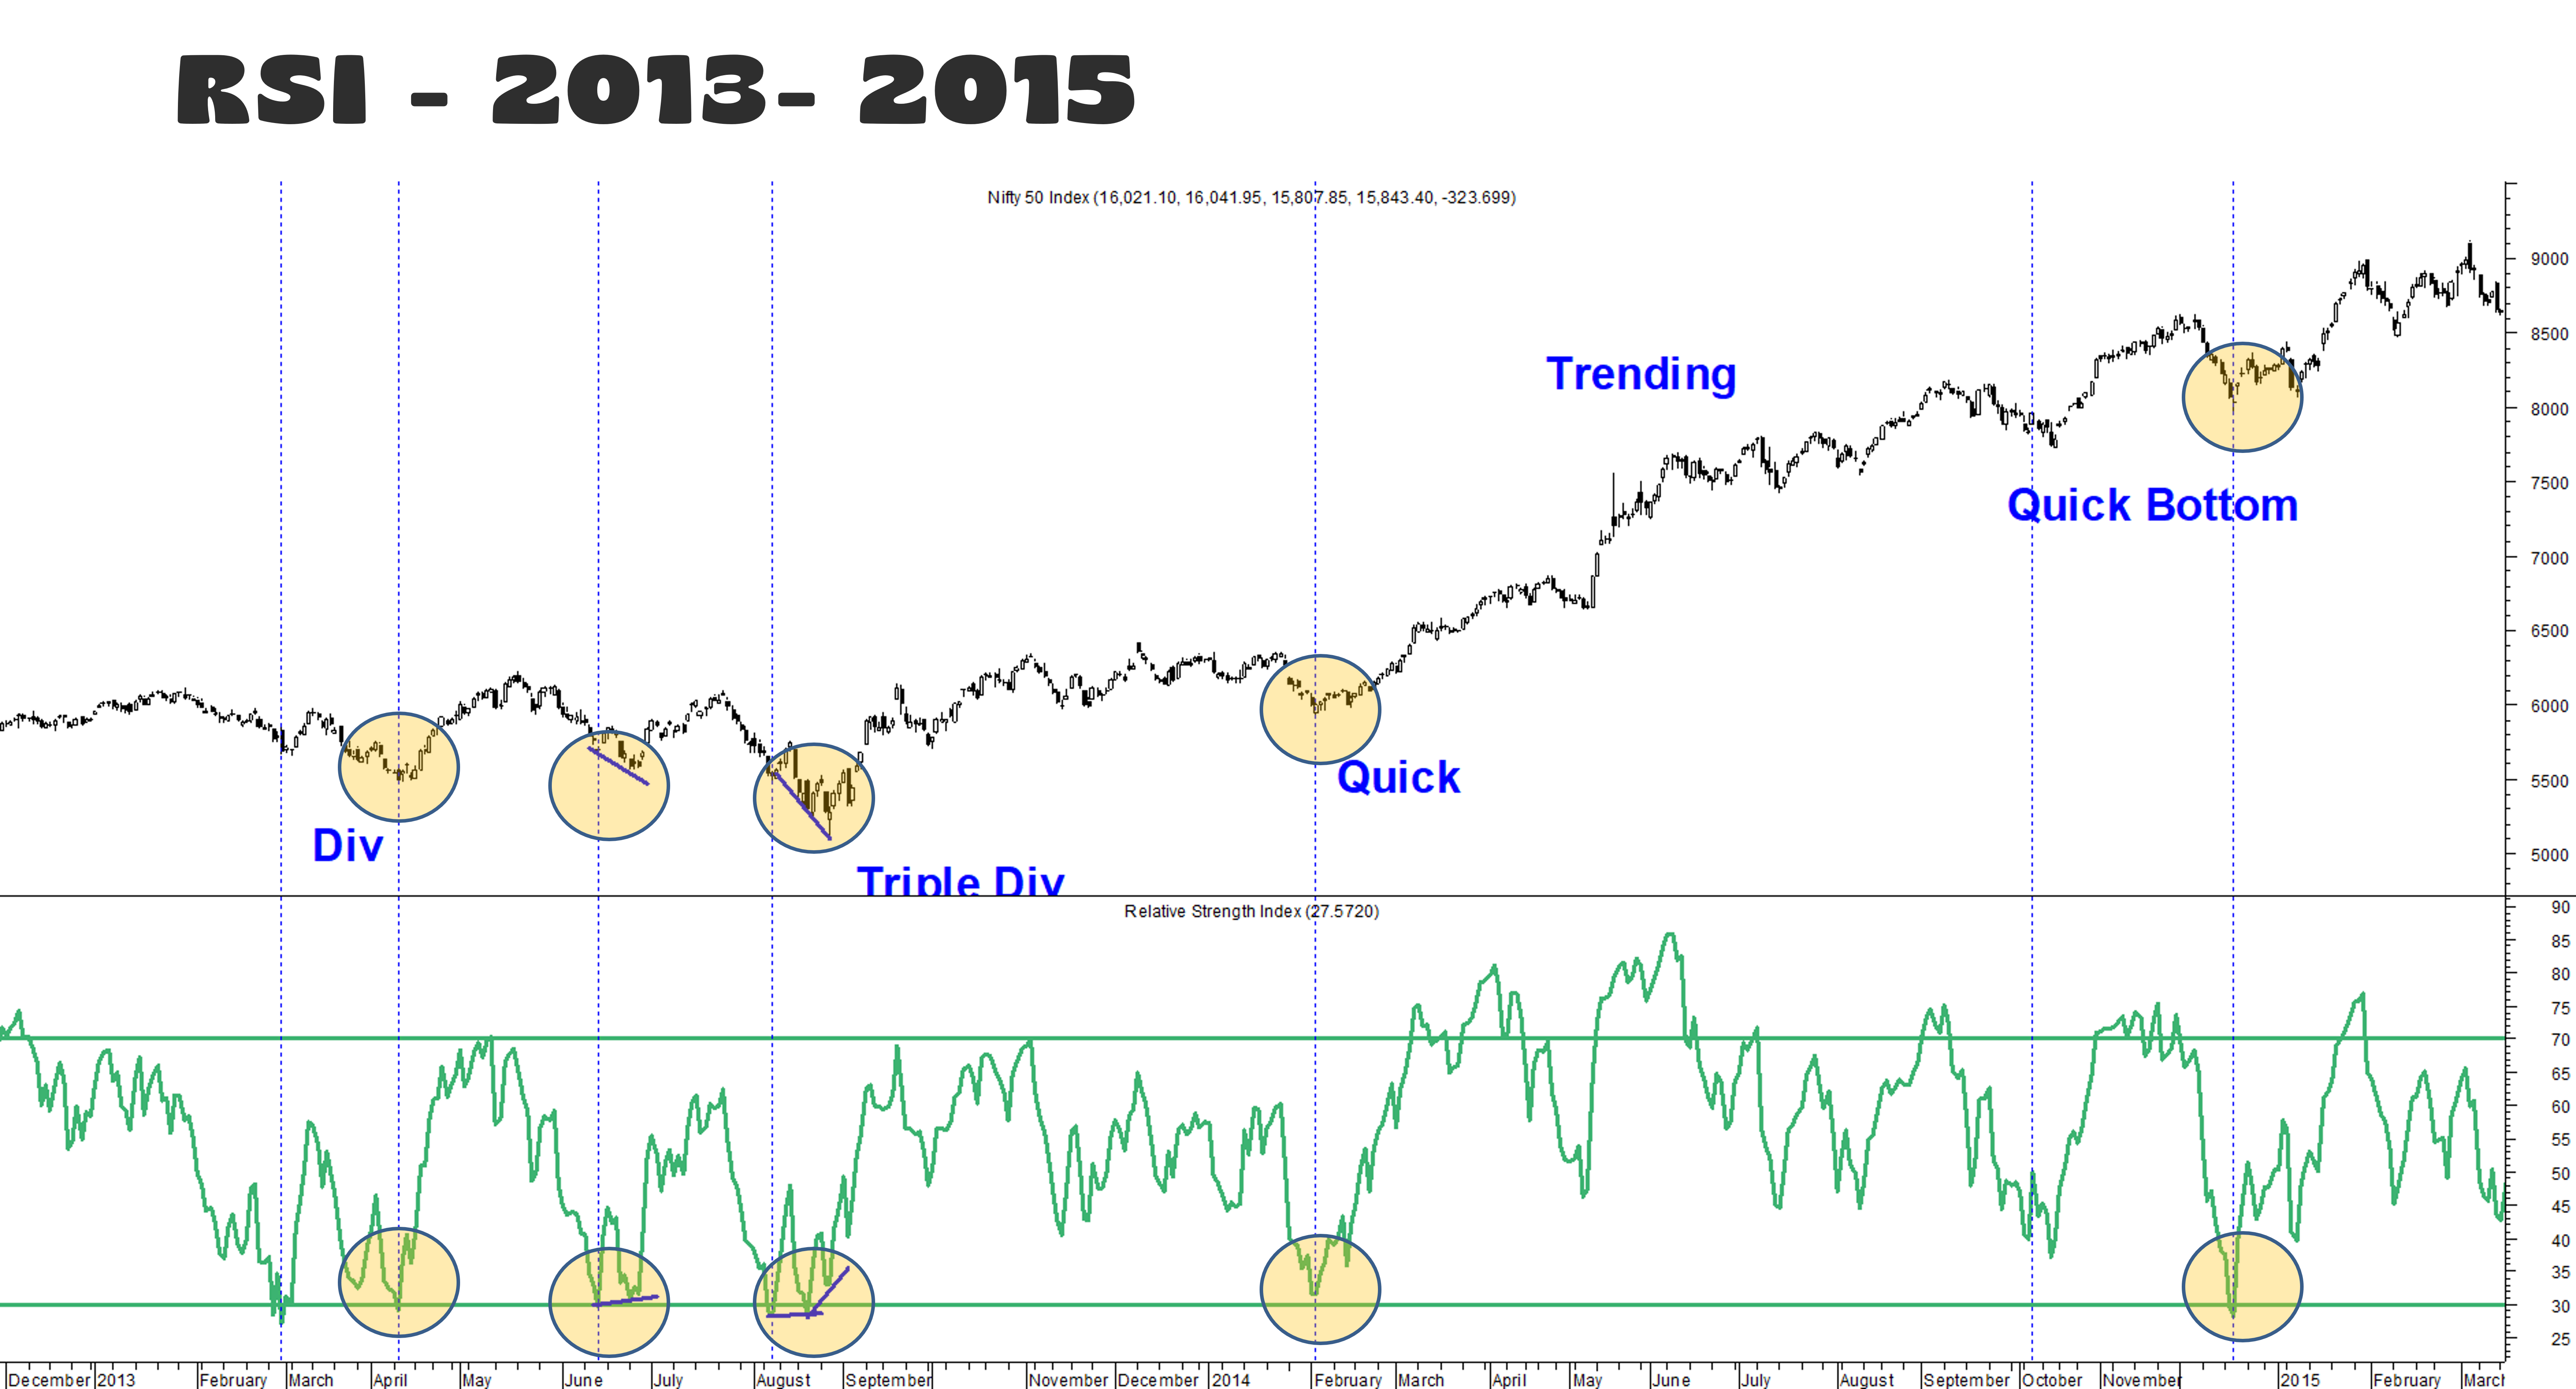
Ex 1,2) +ve Divergence - RSI made a higher low, Nifty made a lower low
Ex 3) Triple +ve divergence - Nifty making a lower low, RSI making a same low followed by a higher low
Ex 4,5,6) Sharp bounce from 30 RSI
RSI 2015 – 2017
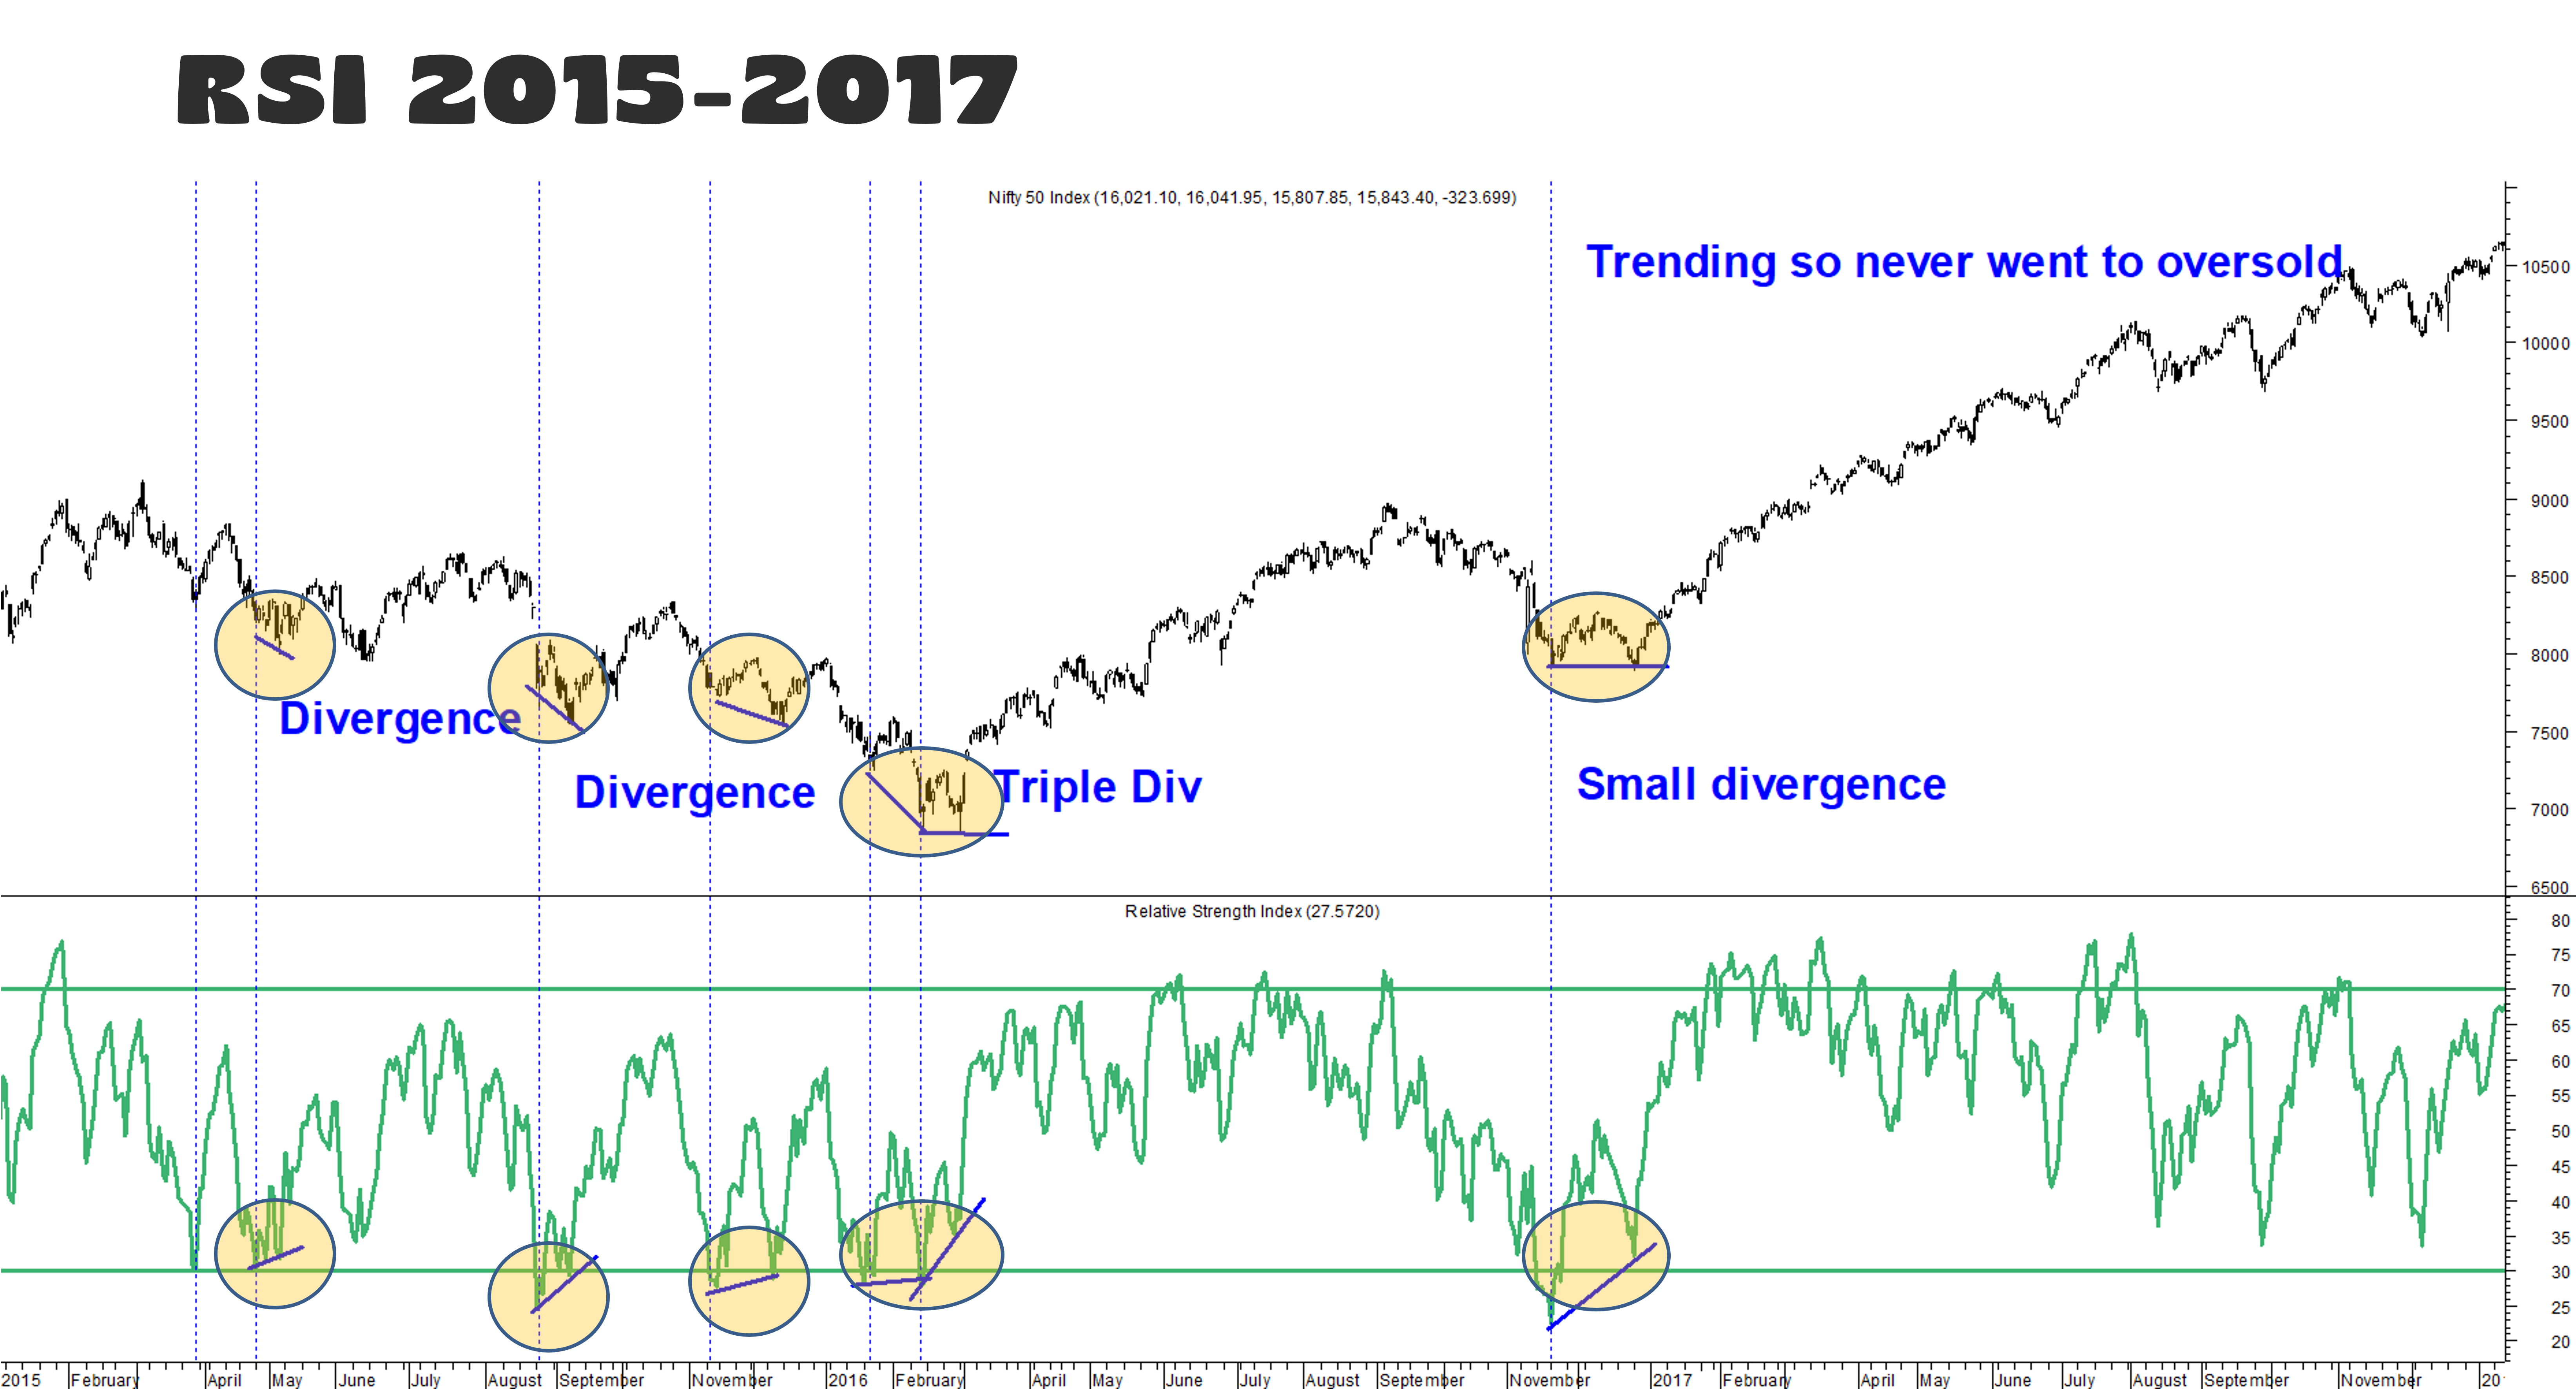
Ex 1,2,3) +ve Divergence - RSI made a higher low, Nifty made a lower low
Ex 4) Triple +ve divergence - Nifty making a lower low, RSI making the same low followed by a higher low
Ex 5) +ve Divergence - RSI made a higher low, Nifty made a same low
RSI 2018 - 2020

Ex 1,2) +ve Divergence - RSI made a higher low, Nifty made a lower low
Ex 3) Bounce from 30 RSI
Ex 4) +ve Divergence - RSI made a higher low, Nifty made a lower low
Ex 5) All hell break loose - Sharp fall due to covid – RSI falling slowly, Nifty fell rapidly, tough period couldn’t predict anything
RSI – Post Pandemic
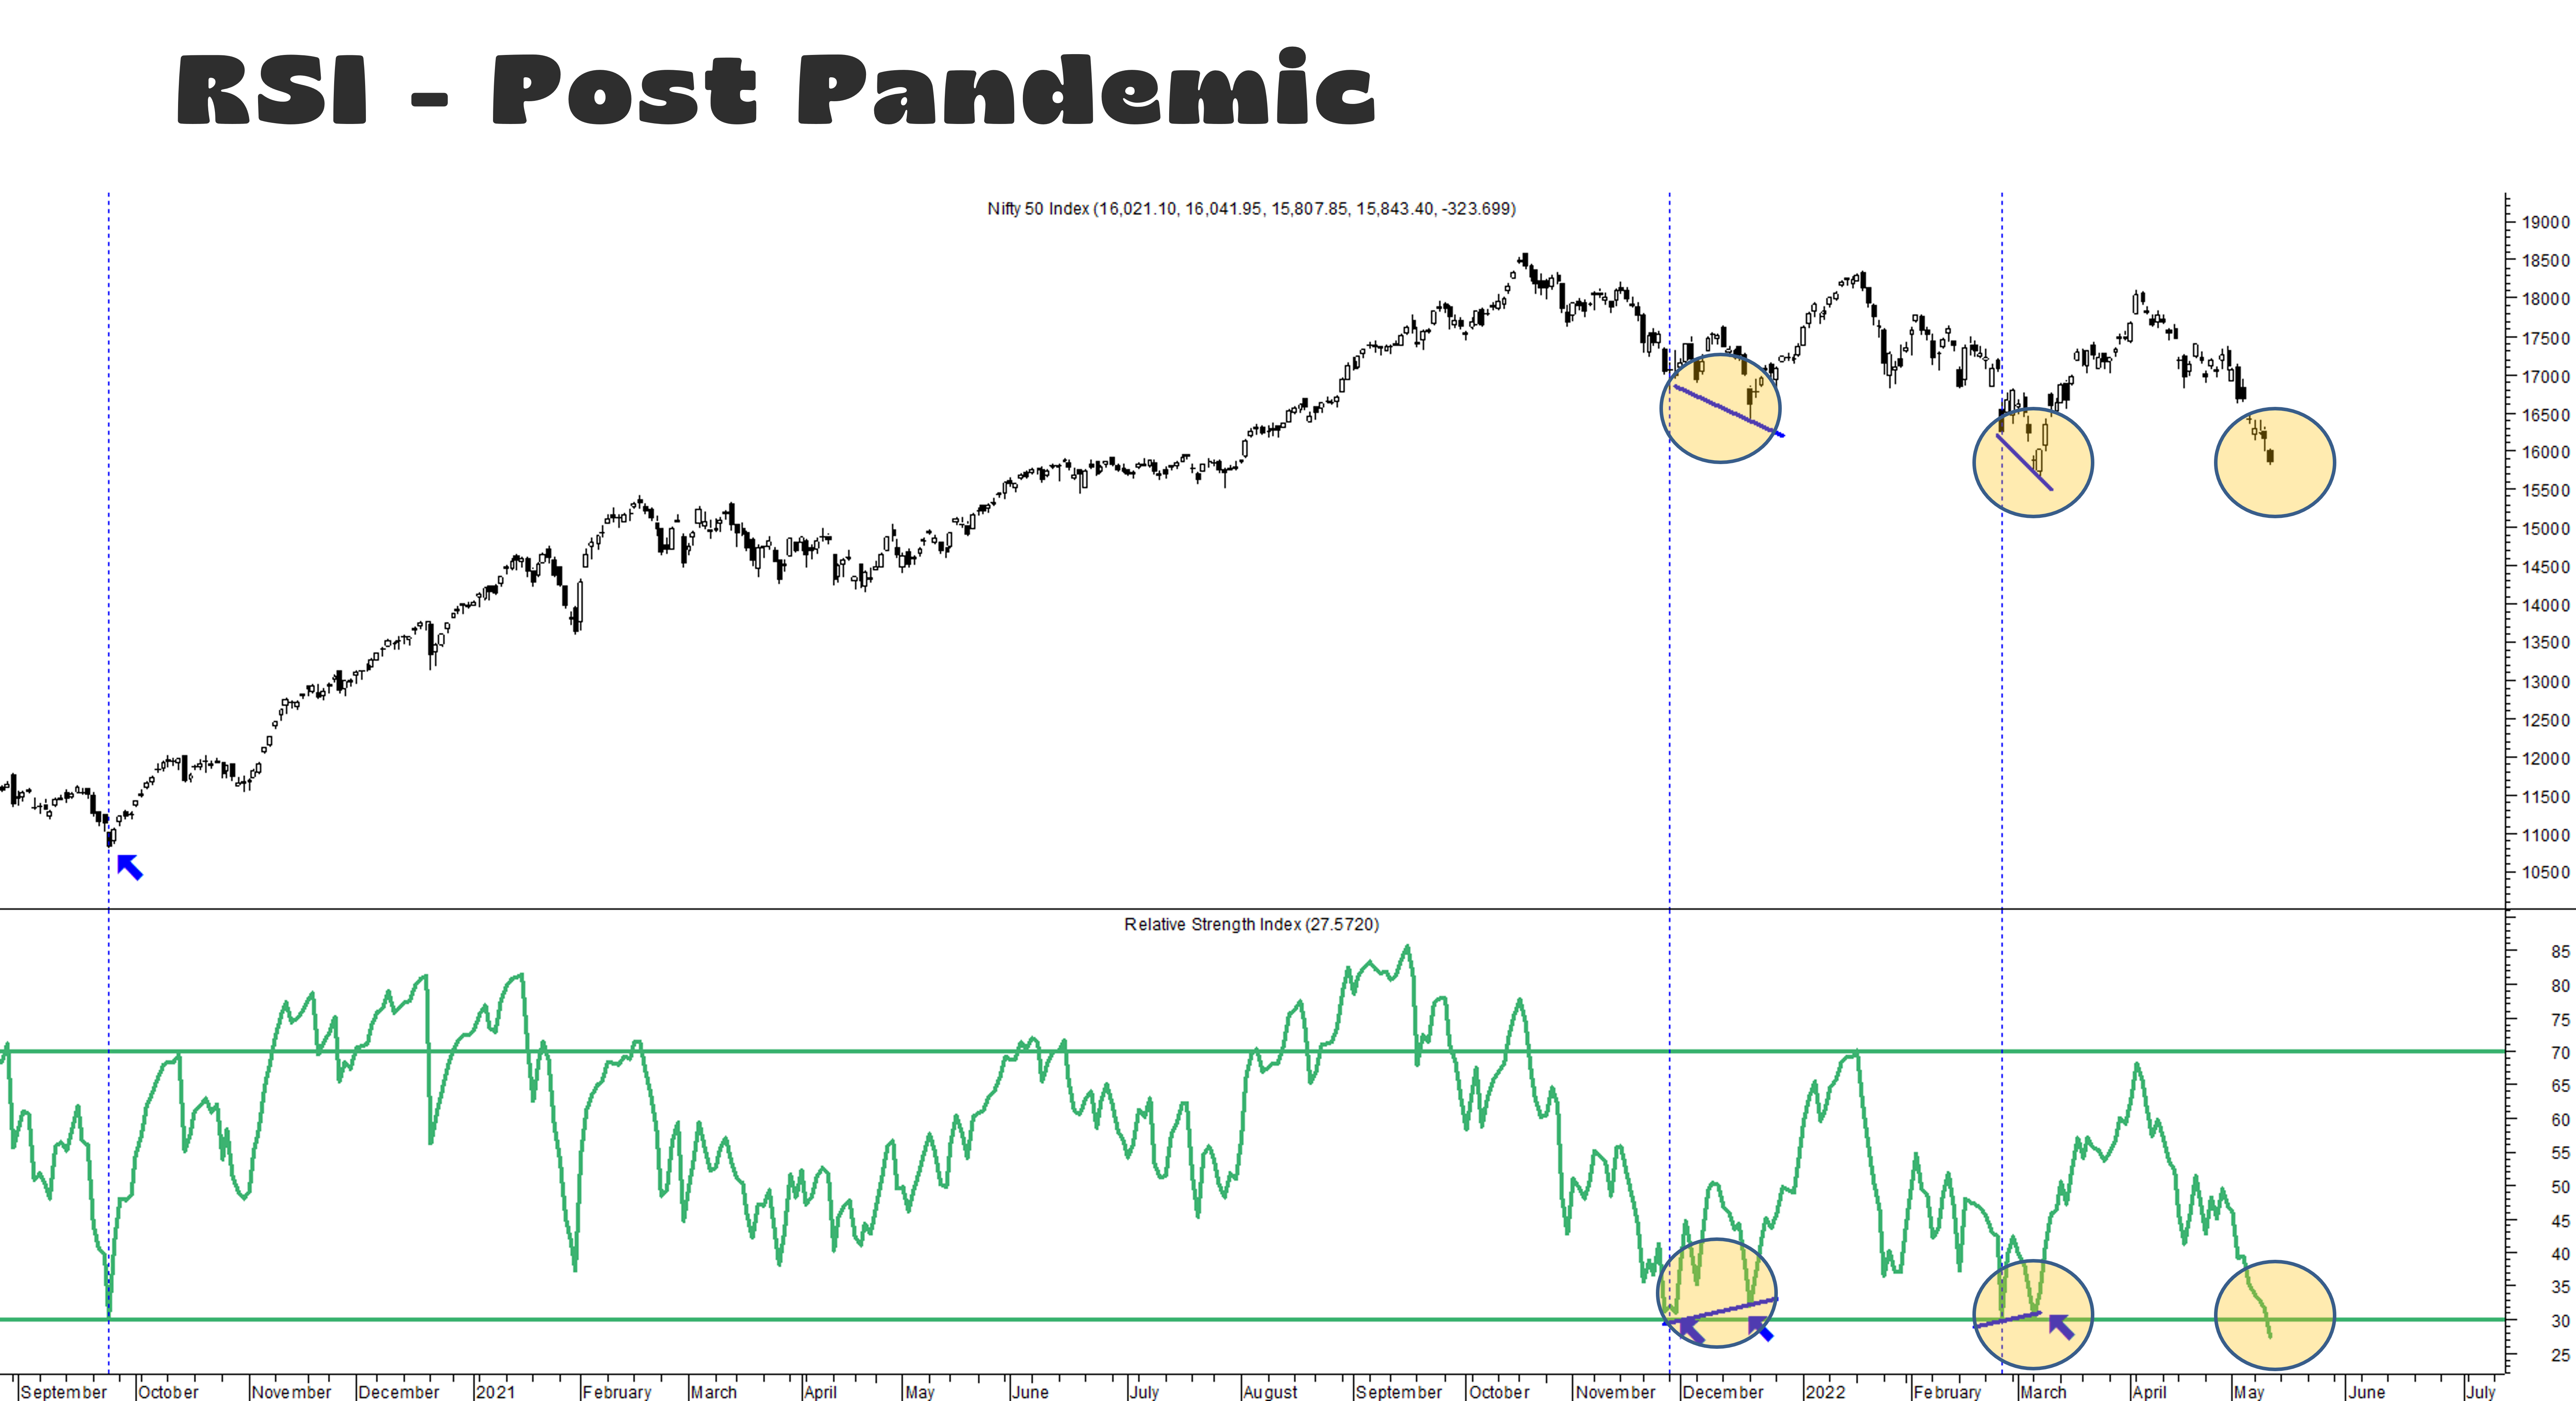
Ex 1) Bounce from 30 RSI
Ex 2,3) +ve Divergence - RSI made a higher low, Nifty made a lower low
Ex 4) Current Fall – Question to ask
- Will there be a sharp bounce from 30 RSI?
- Will there be one more dip followed by a divergence?
- Fall is similar to 2008 or 2020? Nifty falls rapidly?
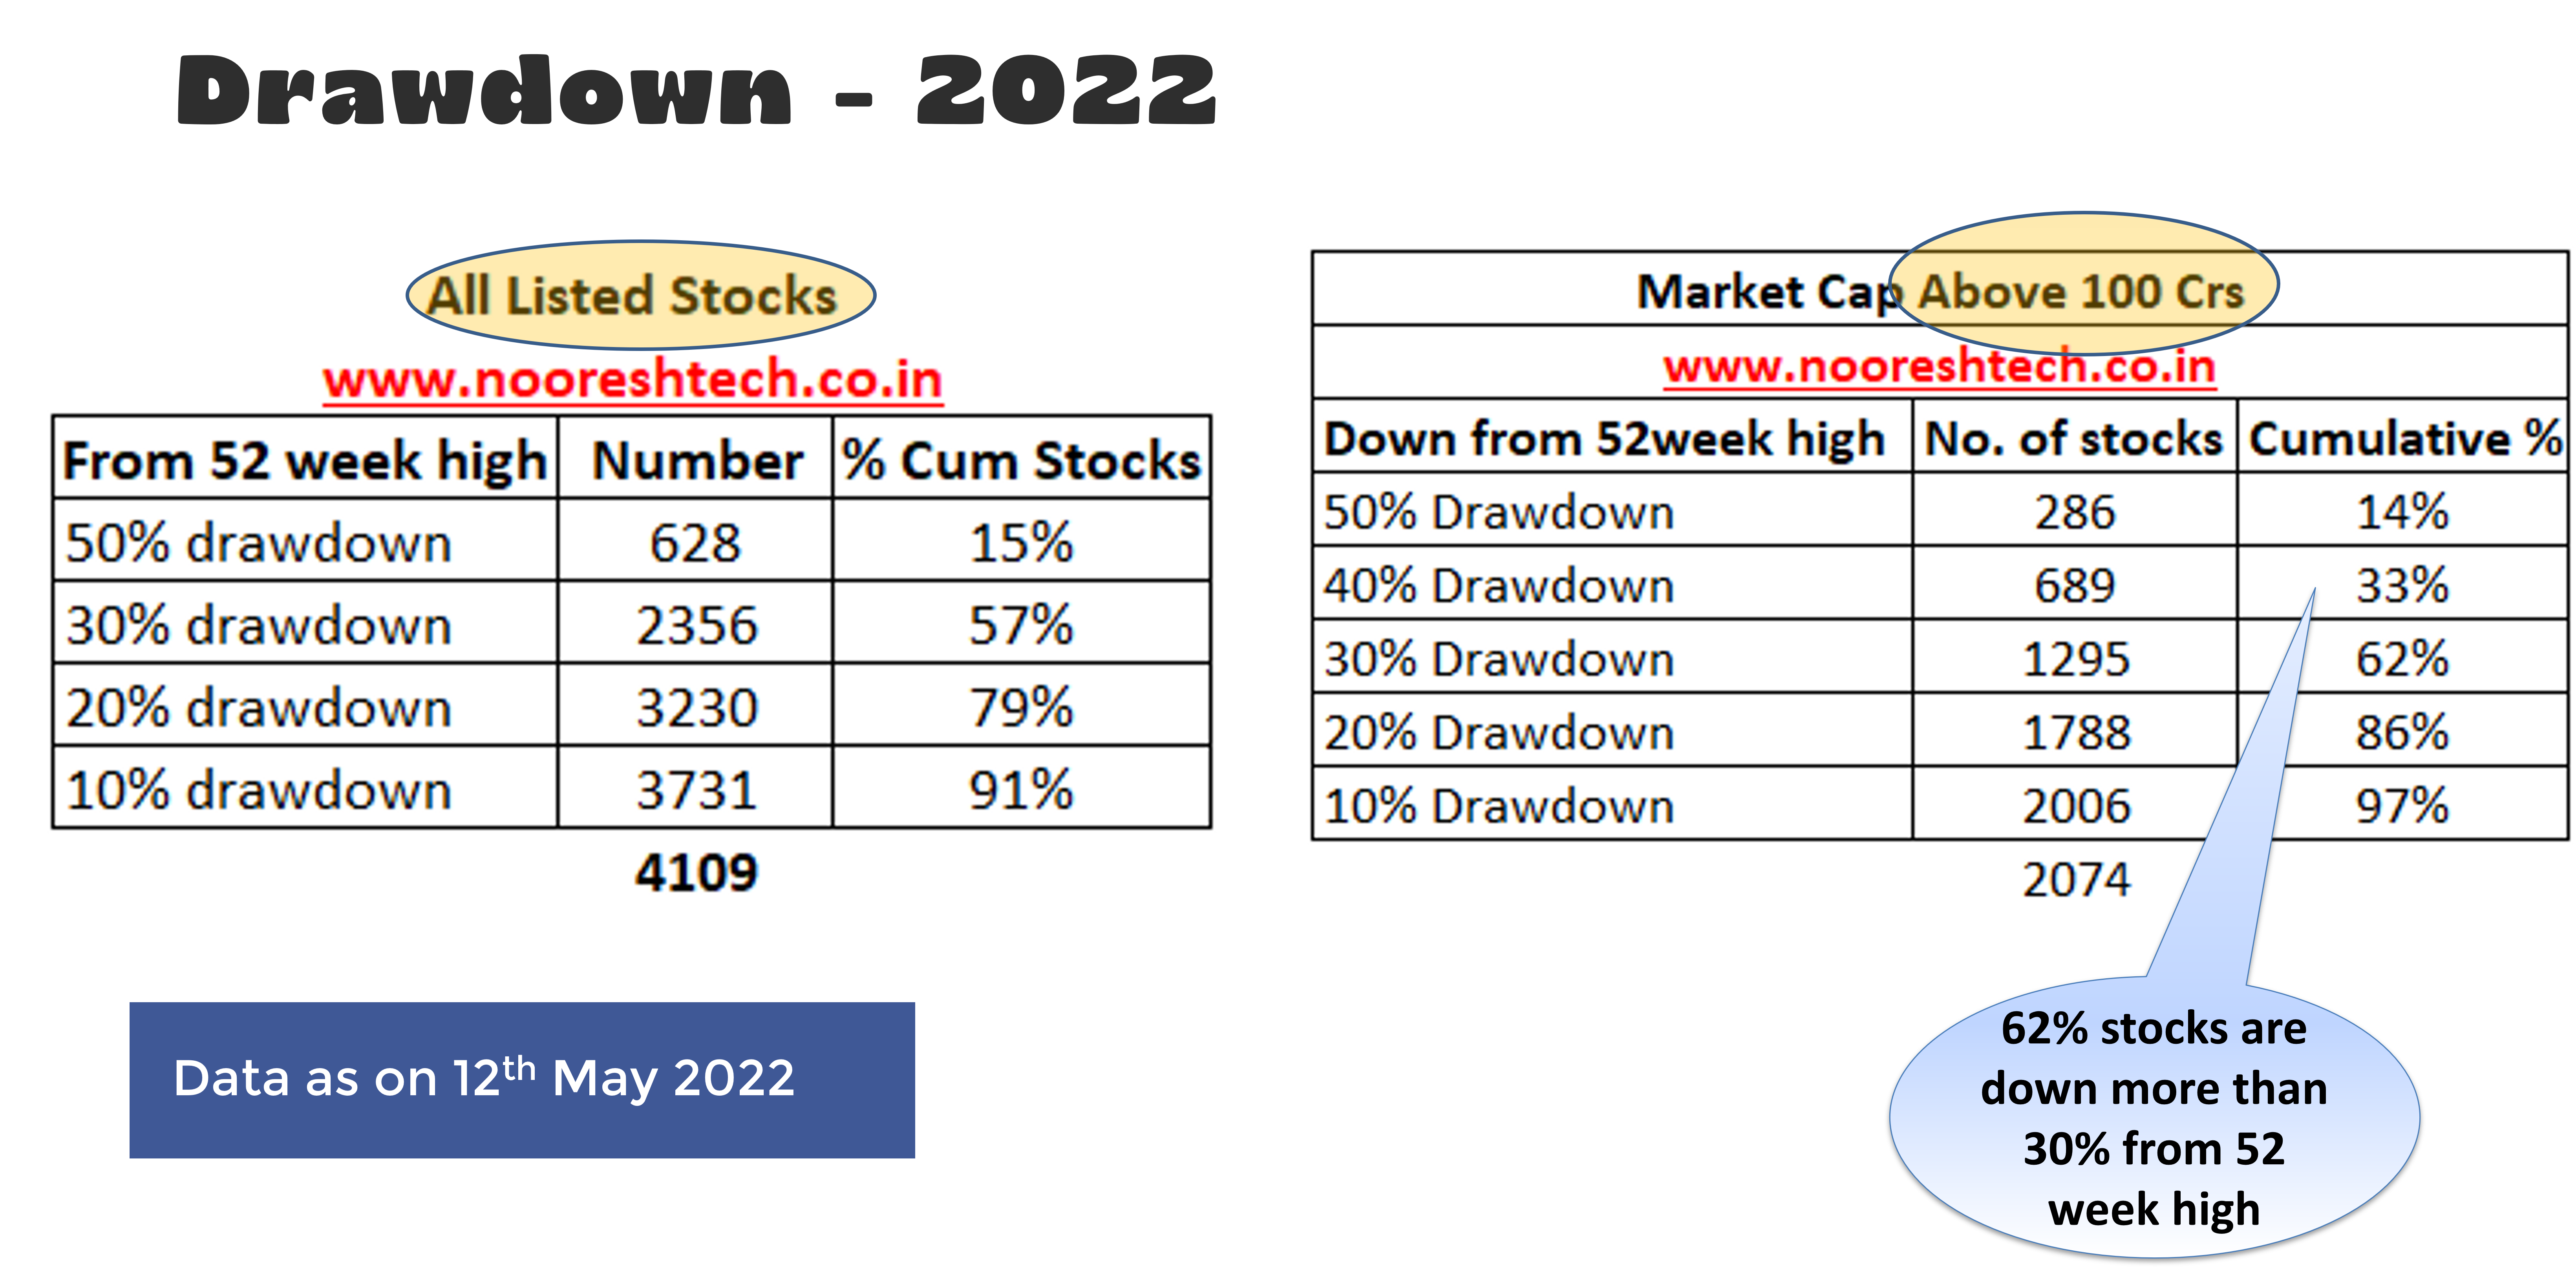
Broader market drawdown
We try and analyse broader market drawdown from its respective 52-week highs, to judge how bad the situation as compared to the previous cycles
- Current Drawdown - Below is the drawdown data from 52 week high as on 12th May 2022
All listed scrips - 57% stocks are down more than 30% from its 52 week high
Above 100crs market cap - 62% stocks are down more than 30% from its 52 week high
Is the current fall done or will it get worse?
What is Worst? – 2020 and 2008
Jan 2018 to March 2020 - 89% stocks down more than 25%
Jan 2020 to March 2020 - 88% stocks down more than 25%

Jan 2008 to March 2008 - 98% stocks down more than 25%

Questions to ask?
- Is the correction over?
- Is it going to get worse like 2008 or 2020?
Also look at Russell 3000 (US Stocks) - Time for some relief or more pain ?
- #Russel3000 - Almost 10% of the index is down 90% from their highs.
- Nearly 1 in 5 stocks are down 80% from their all-time highs at the moment.
- More than 50% of stocks down 50%
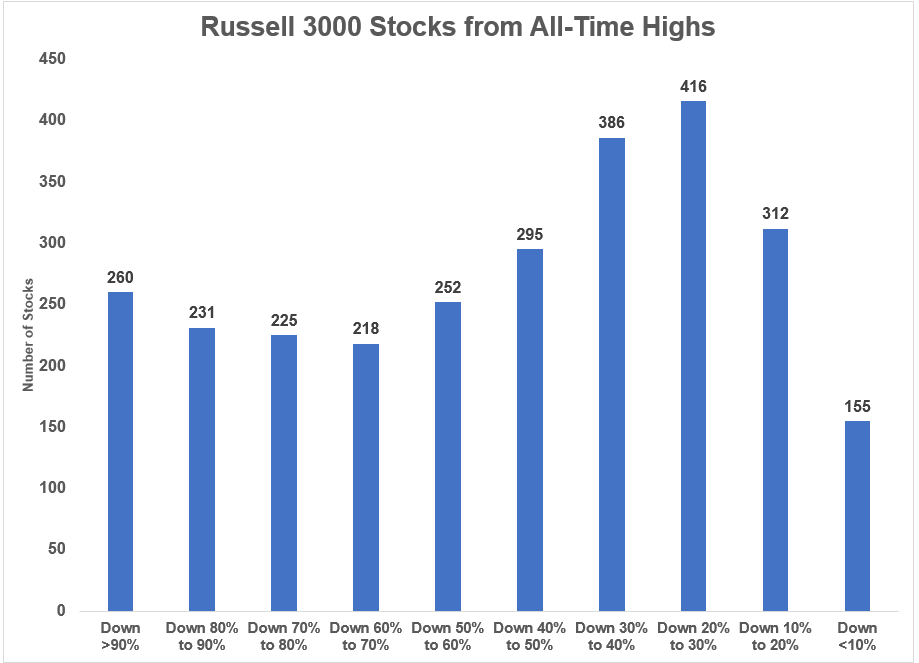
Source: https://awealthofcommonsense.com/2022/05/15-of-the-craziest-charts-right-now/
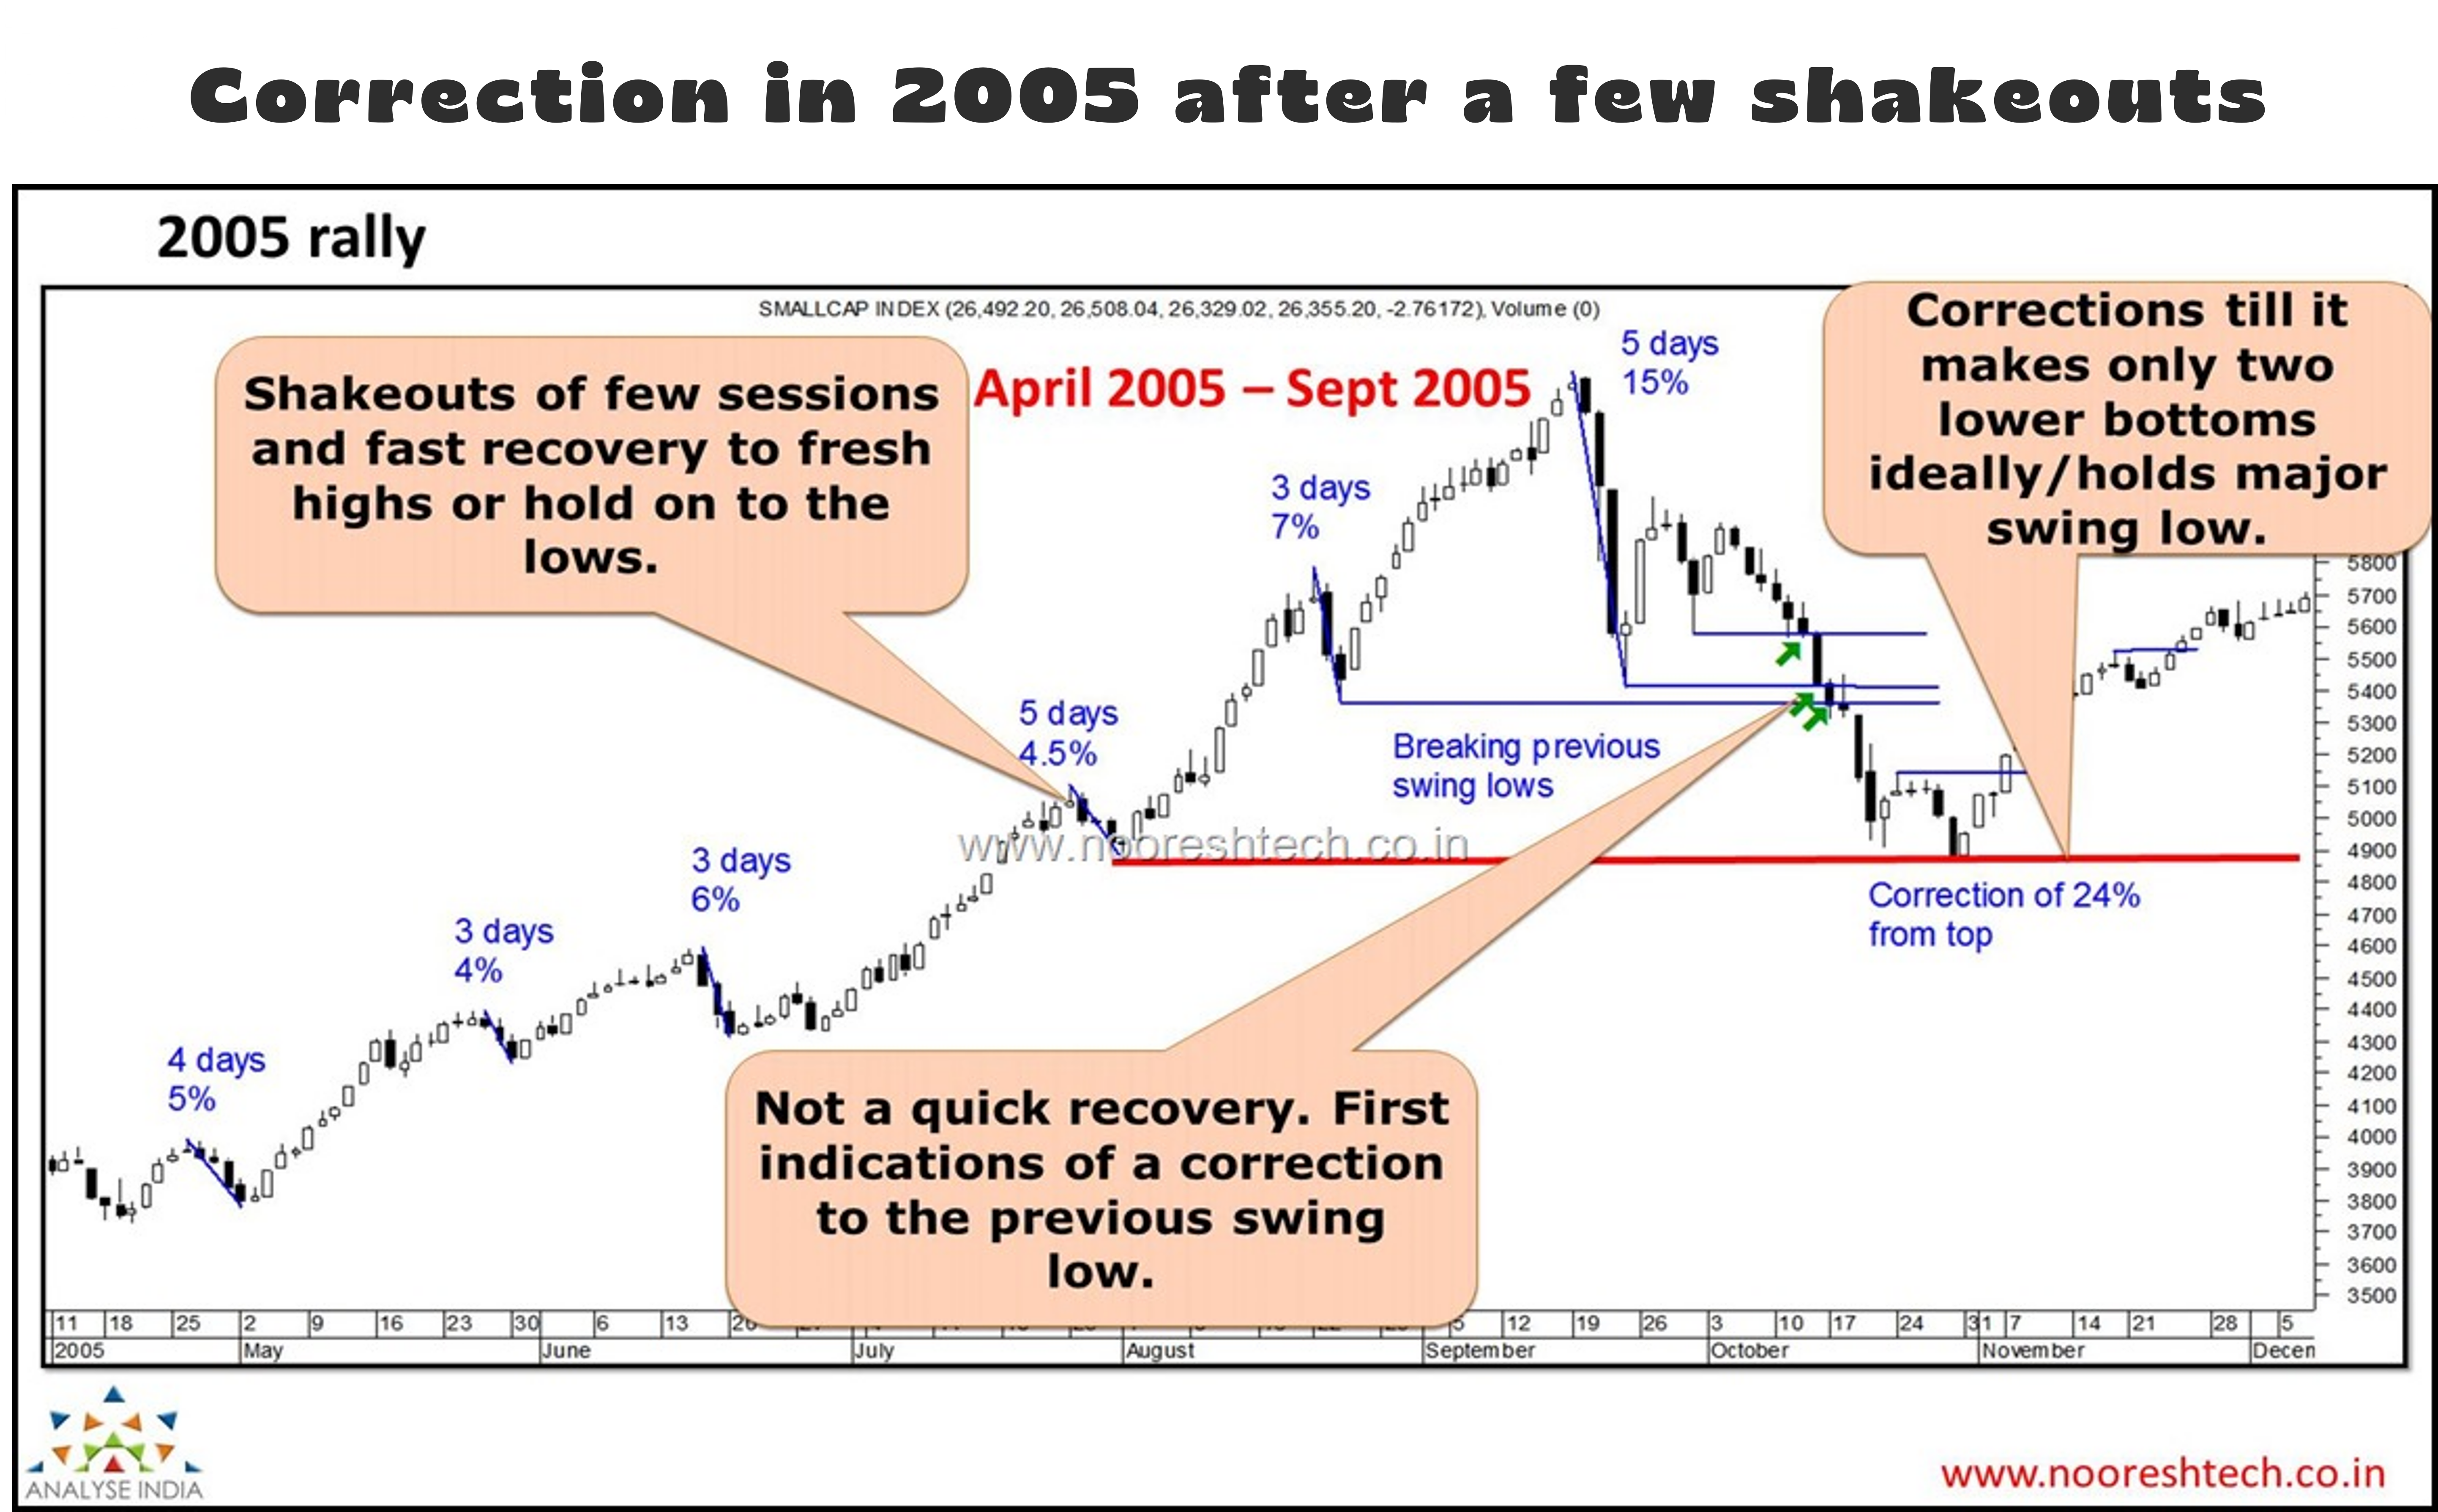
BSE Smallcap Index - Cycles, Shakeouts & Corrections
Correction in 2005 after a few shakeouts -
- Correction of 24% from Top in Sep 2005
Crash or Correction in 2006. -
- Correction of 43% from Top in May 2006

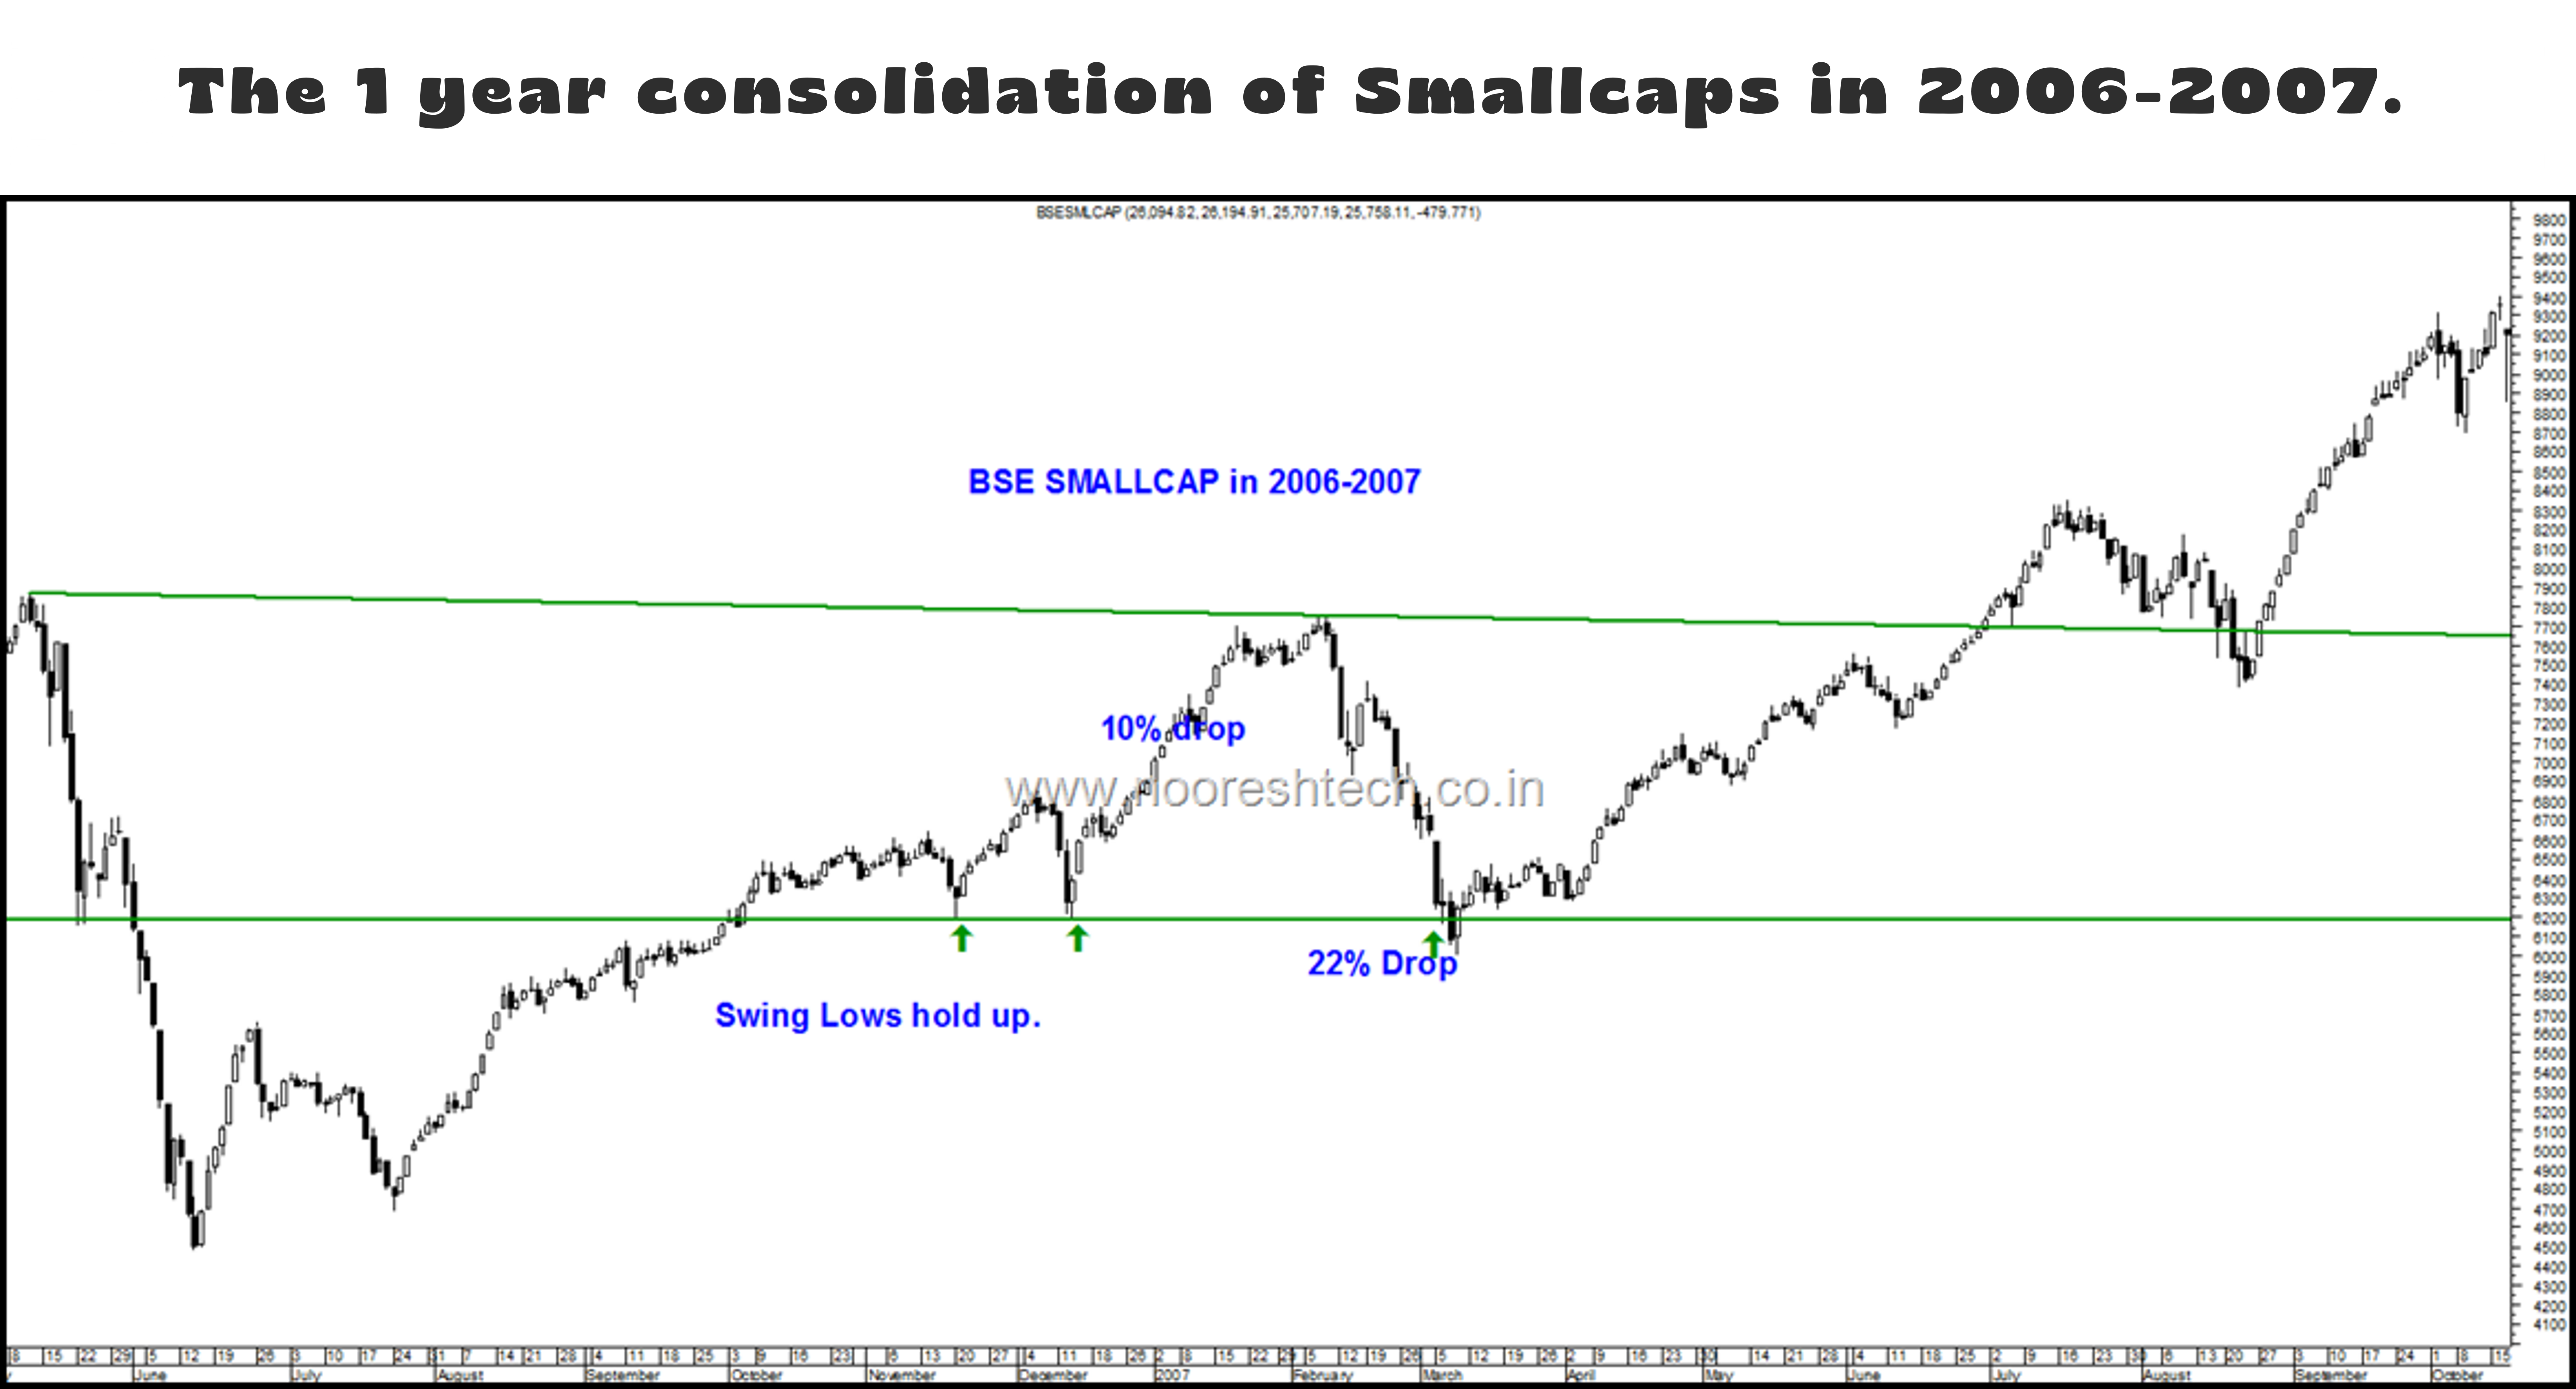
The 1 year consolidation of Smallcaps in 2006-2007 -
- A 22% fall in February 2007
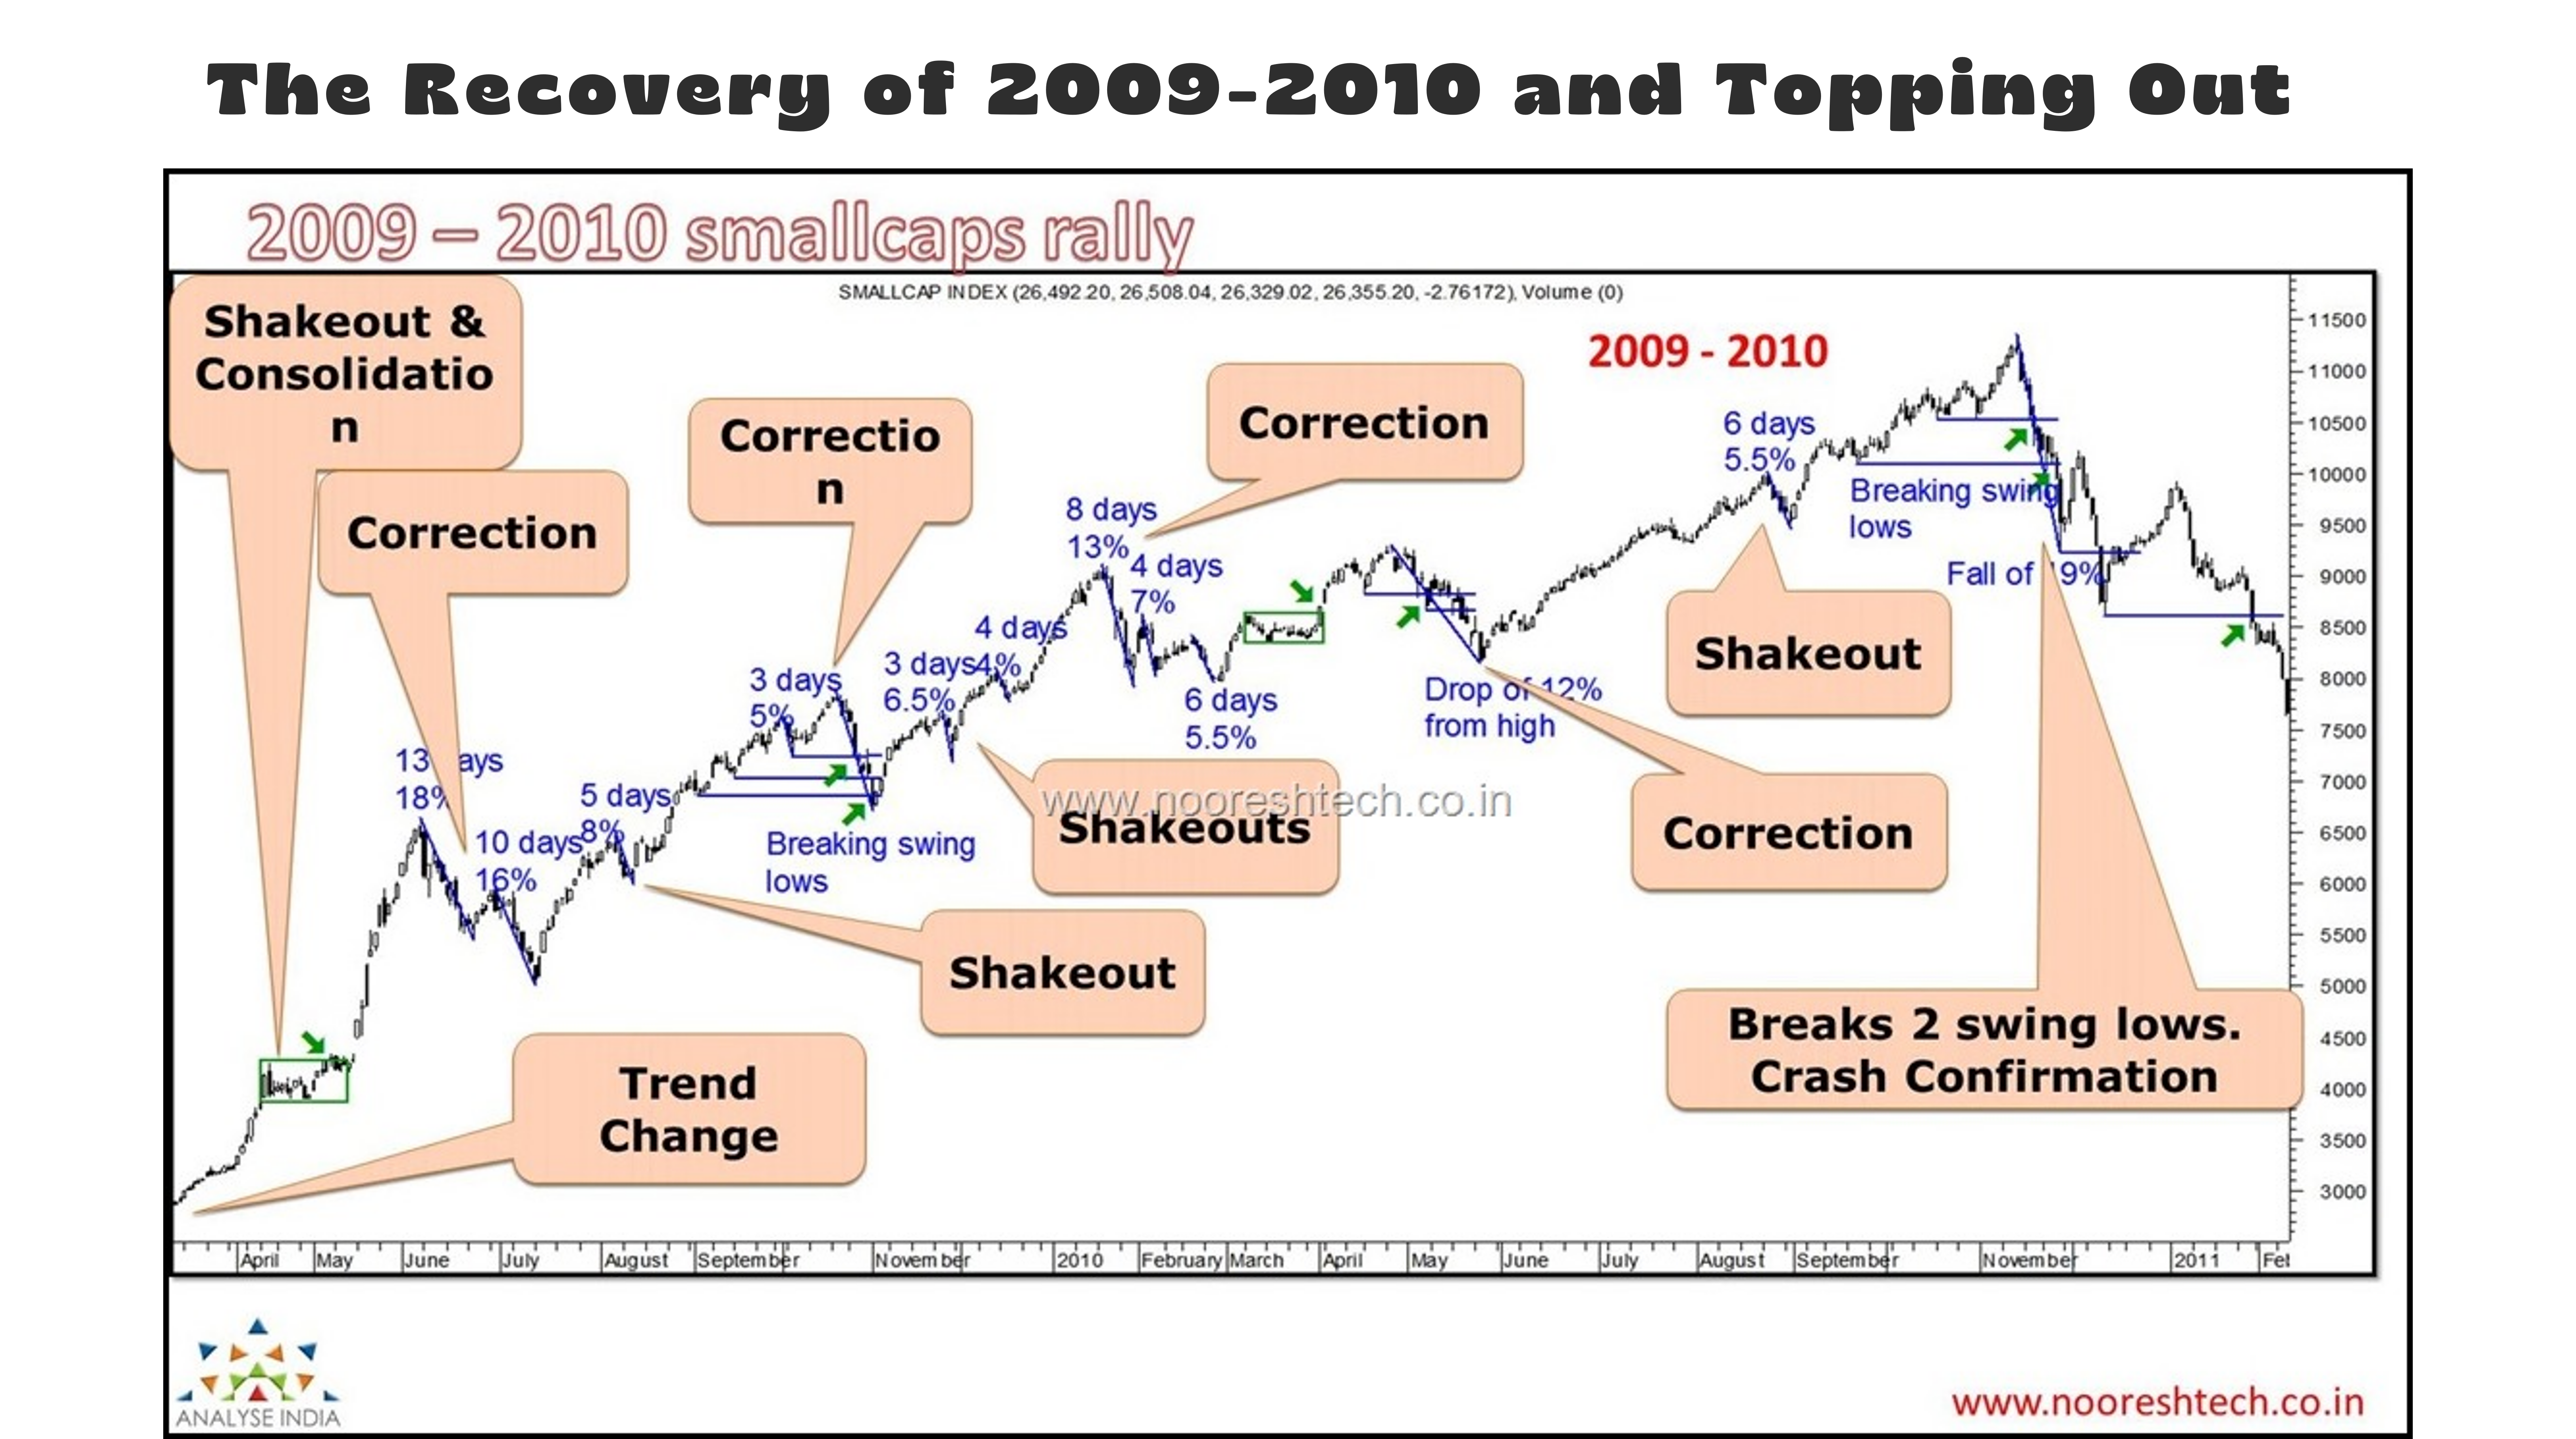
The Recovery of 2009-2010 and Topping Out
- Rally filled with small shakeouts and corrections
- Topping out in 2011
2011 – 2013 Tough Times for Smallcaps
- Worst times for Smallcaps - Slow time as well as price corrections

Shakeout in 2014-2015 and Consolidation of 2015-2016. -
- One year sideways consolidation after steep rise

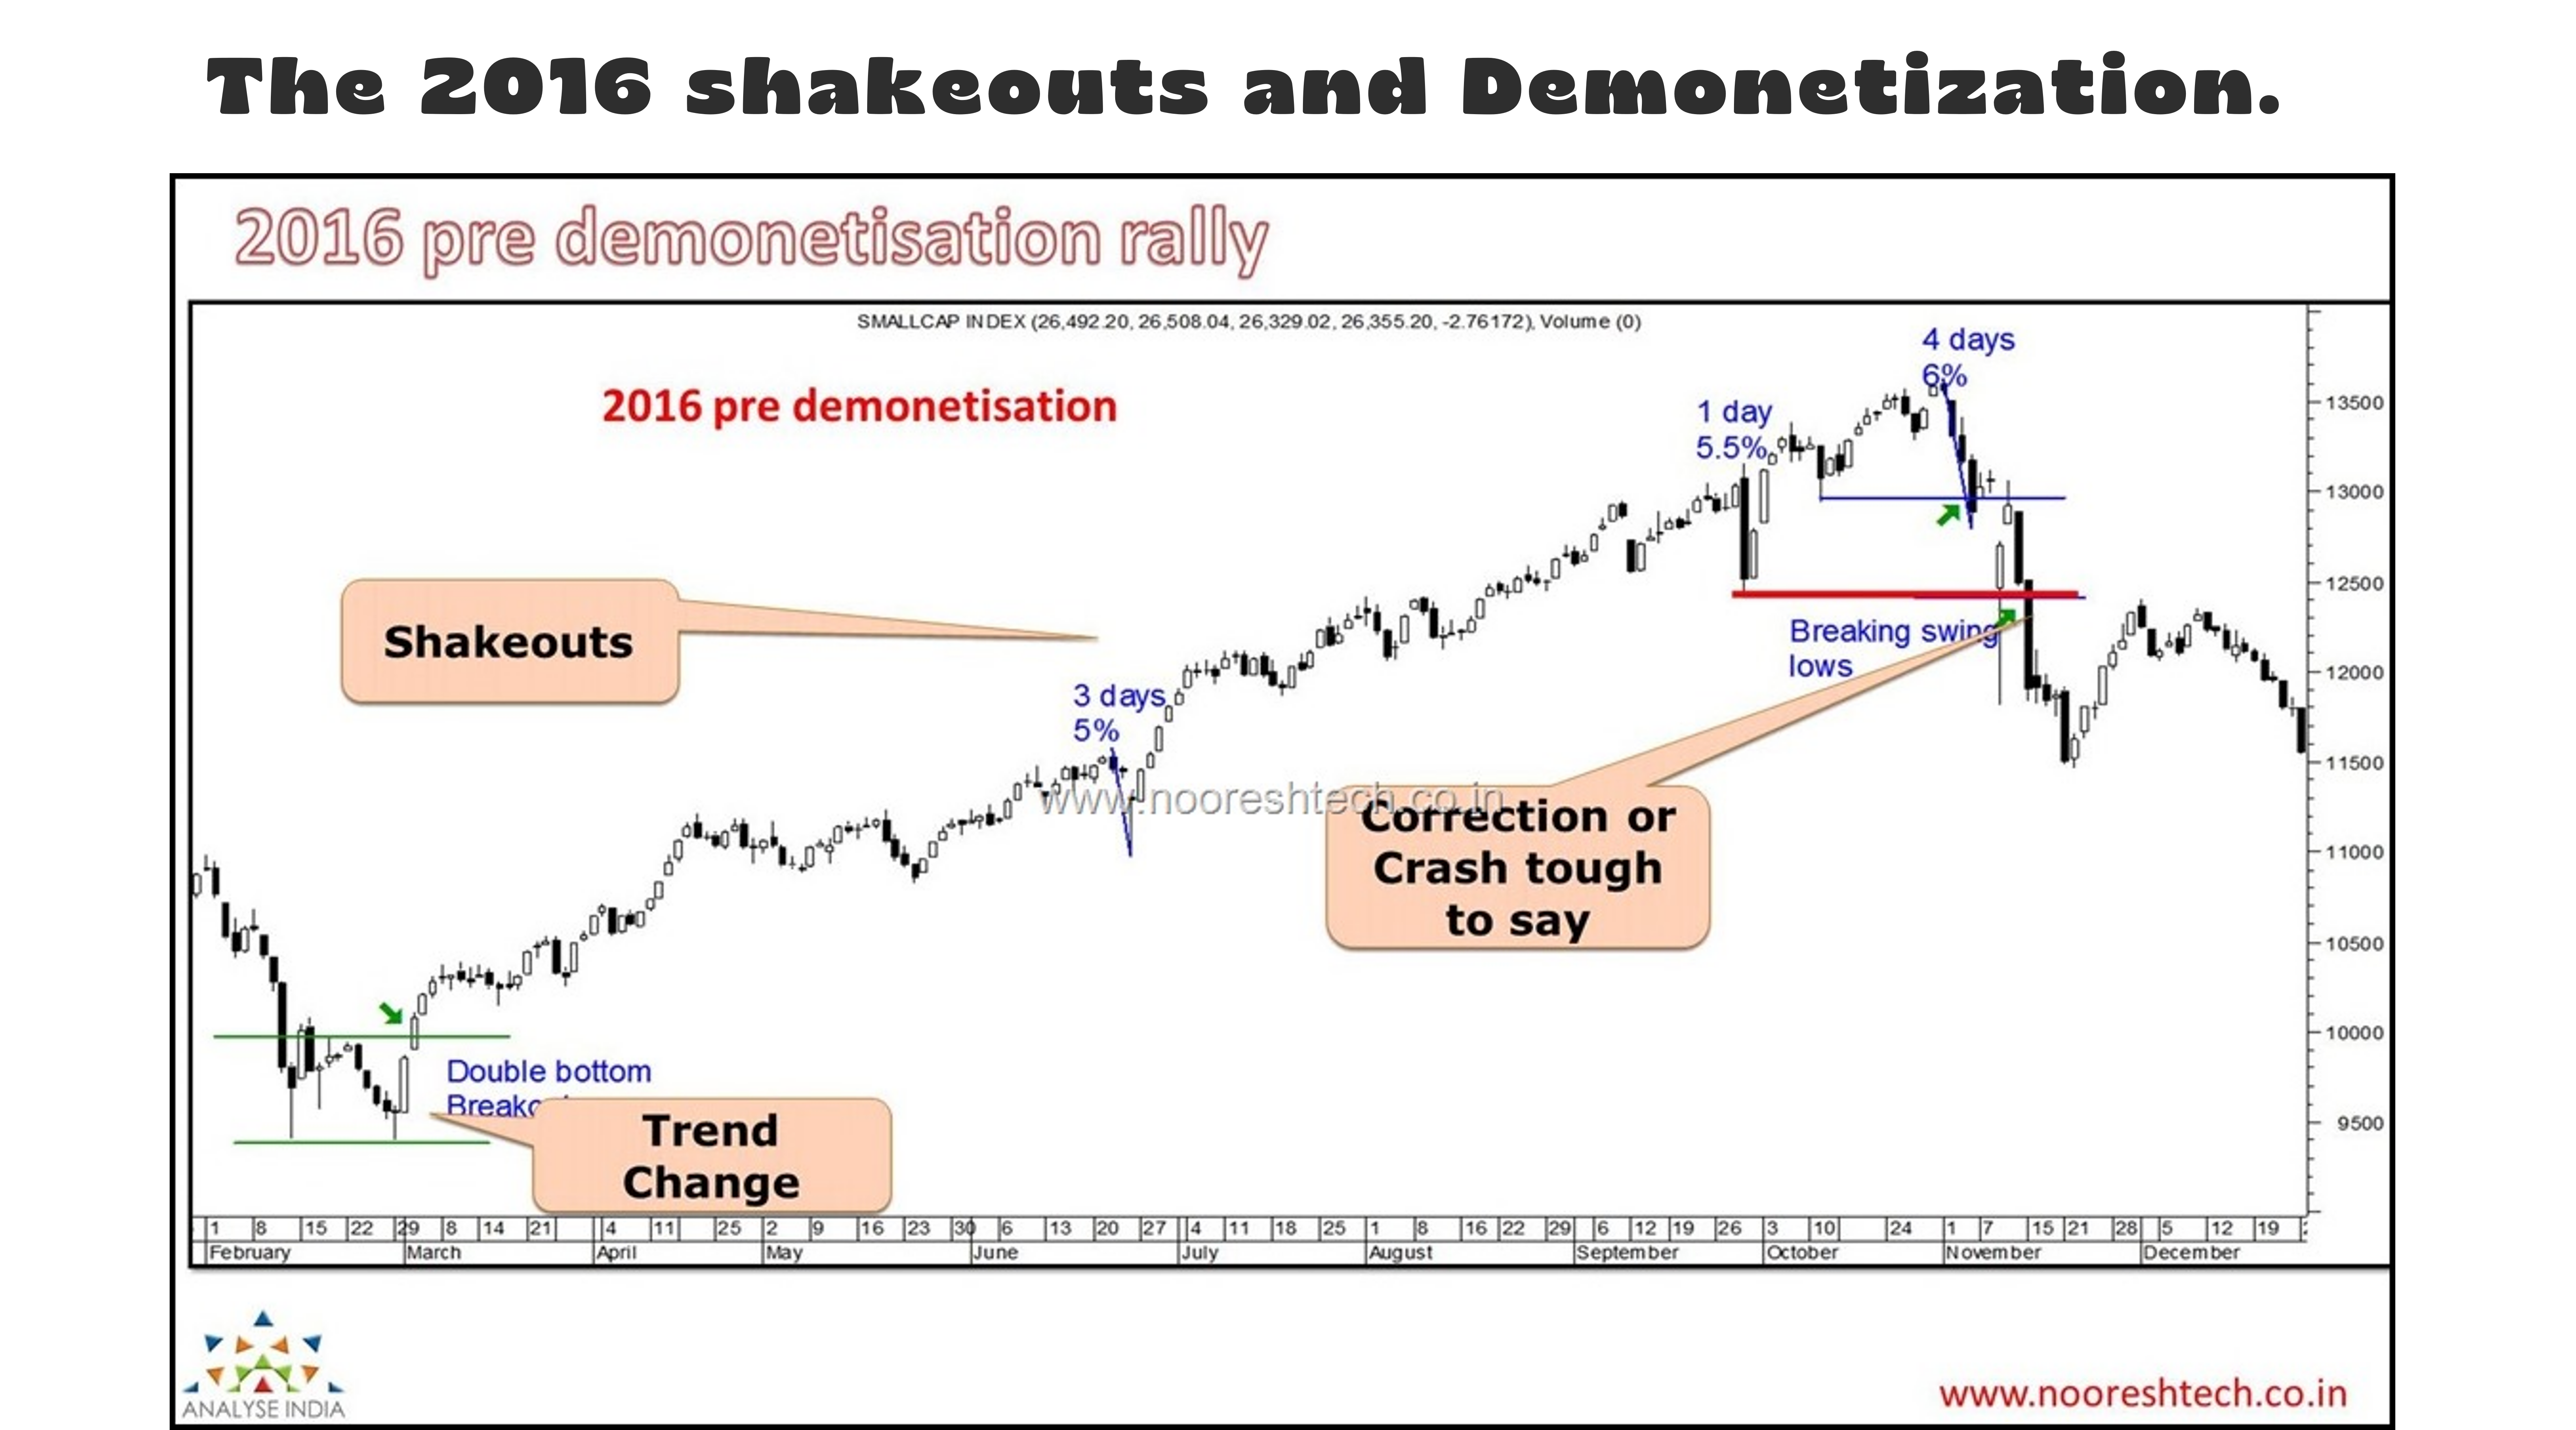
The 2016 shakeouts and Demonetization.
- One year consolidation above, was followed by a breakout
- A steep drop during Demon and US Election
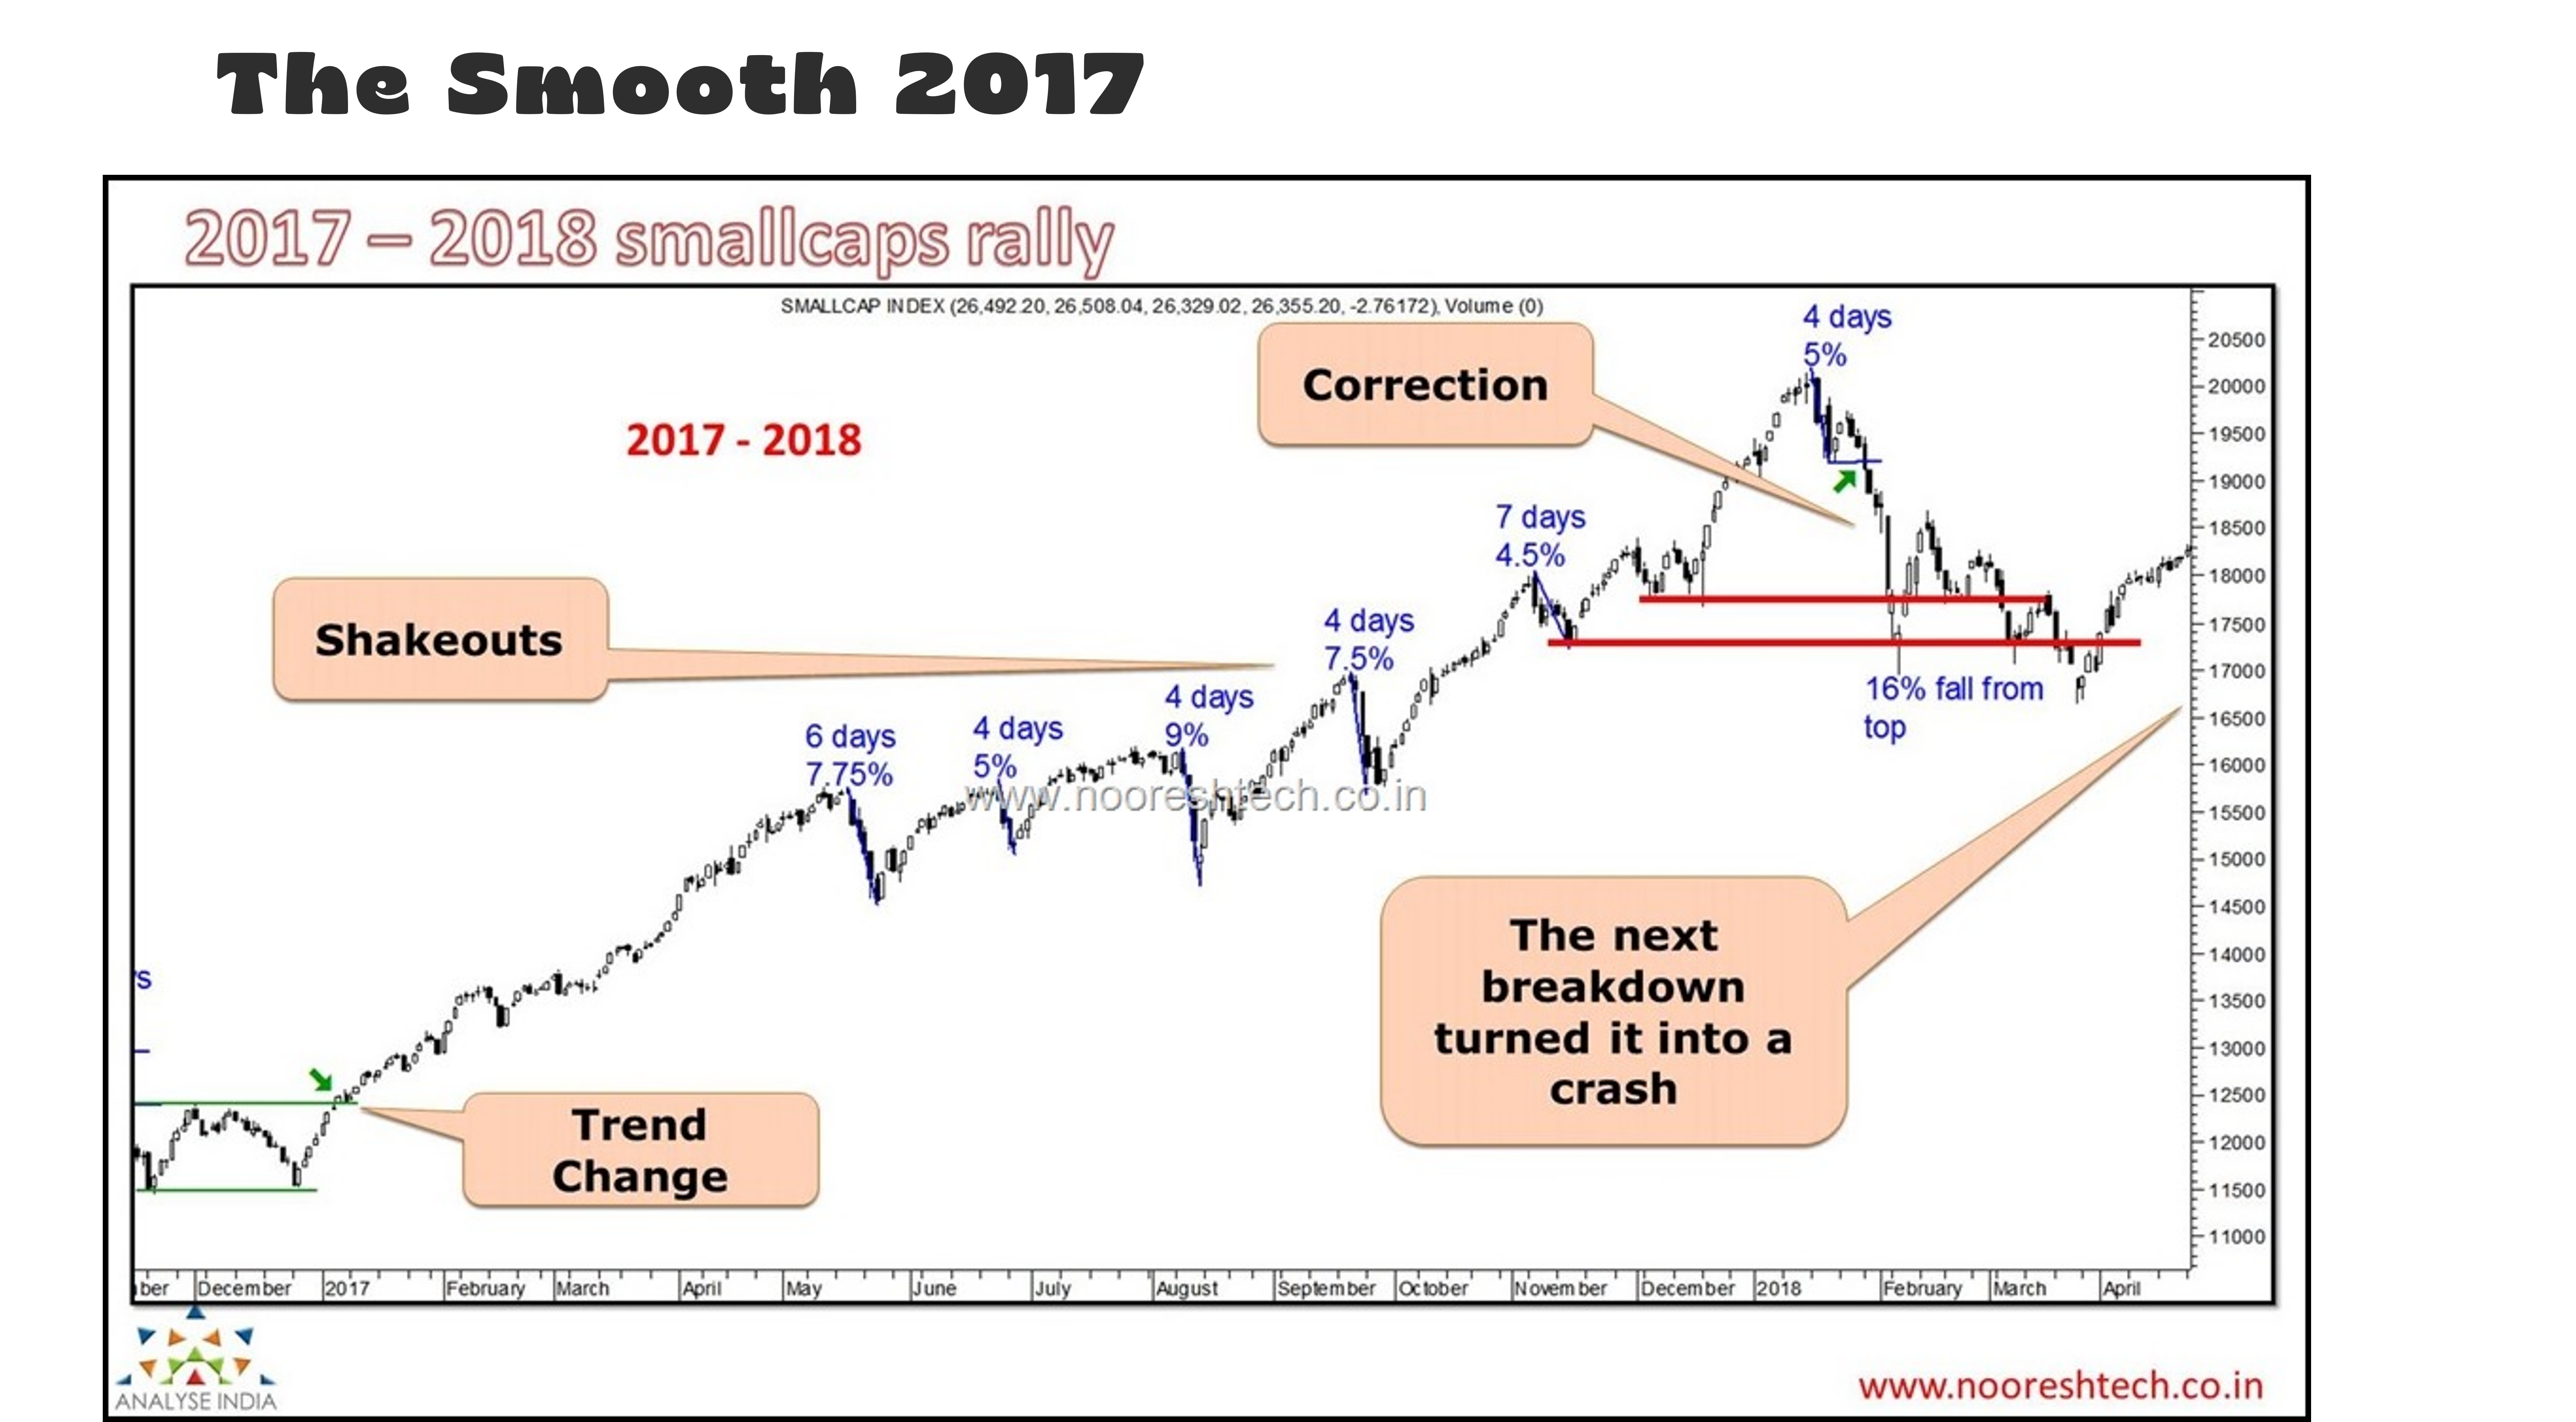
The Smooth 2017 -
- Smooth ride in 2017 followed by topping out in 2018
2018 – 2019 Tough times for smallcaps
- Falls similar to 2011-2013

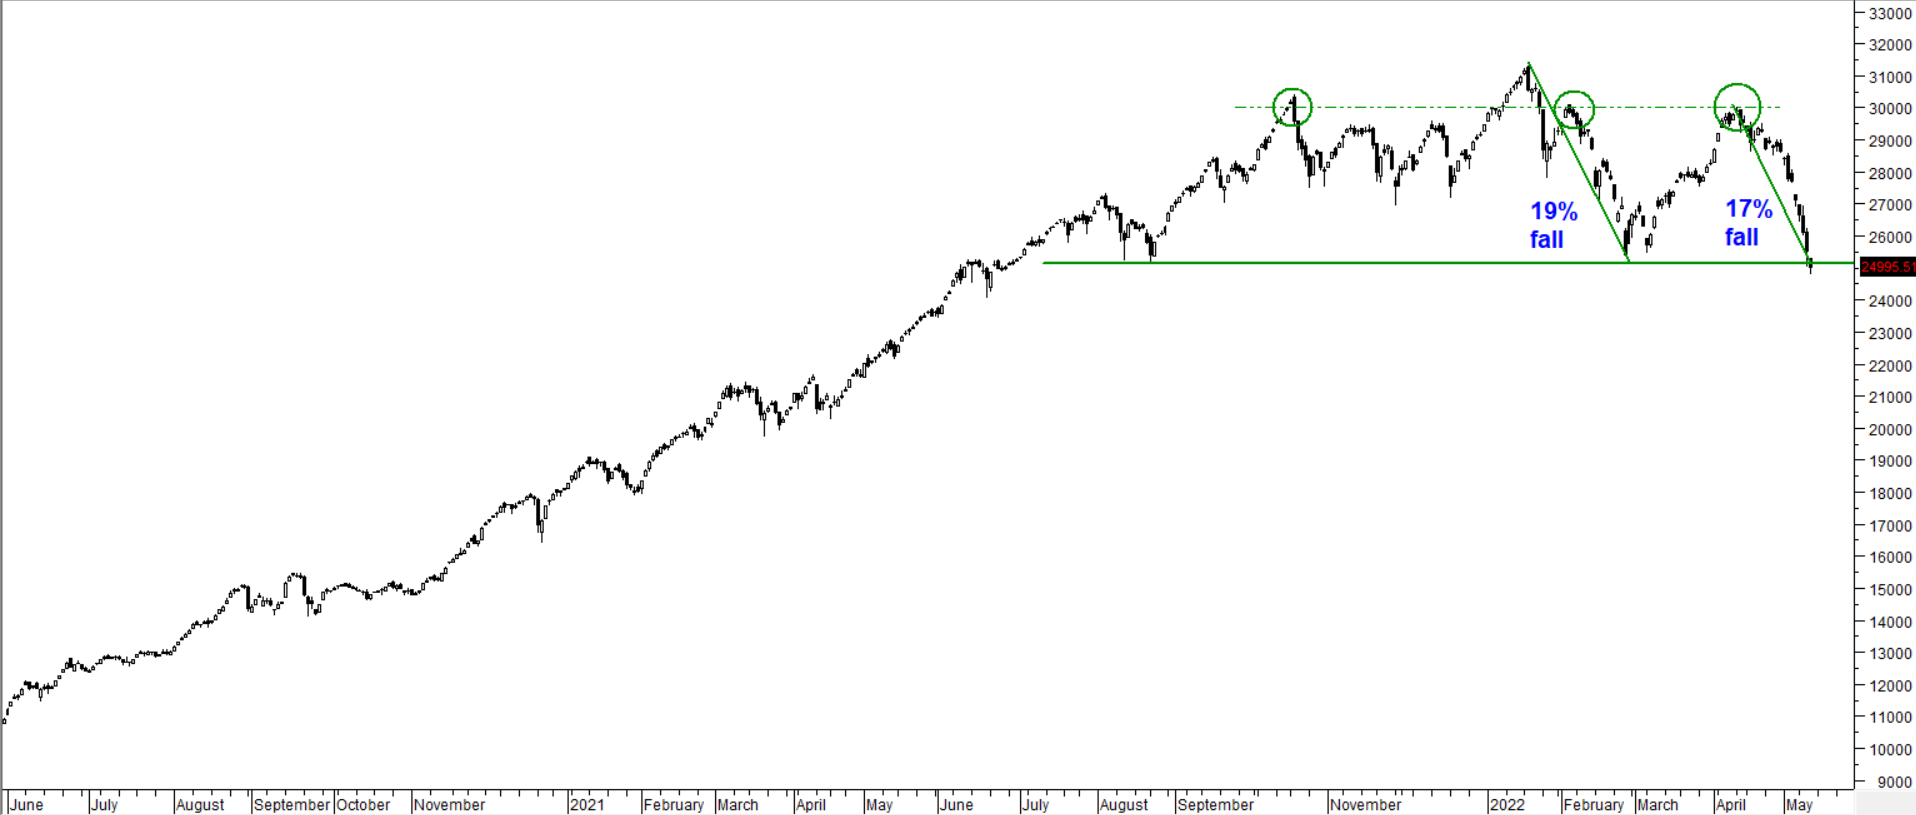
Where are we now? - Questions to ask?
- Have we topped out? Like 2007 / 2010 / 2018 ?
- Are we going in a deeper price and time correction like 2011-2013 or 2018-2020
- Is it a healthy correction in an ongoing bull market? Like 2005 / 2006/ 2007 / 2016 or
- Is the correction similar to 2015-2016? - One year of consolidation before the upmove resumes
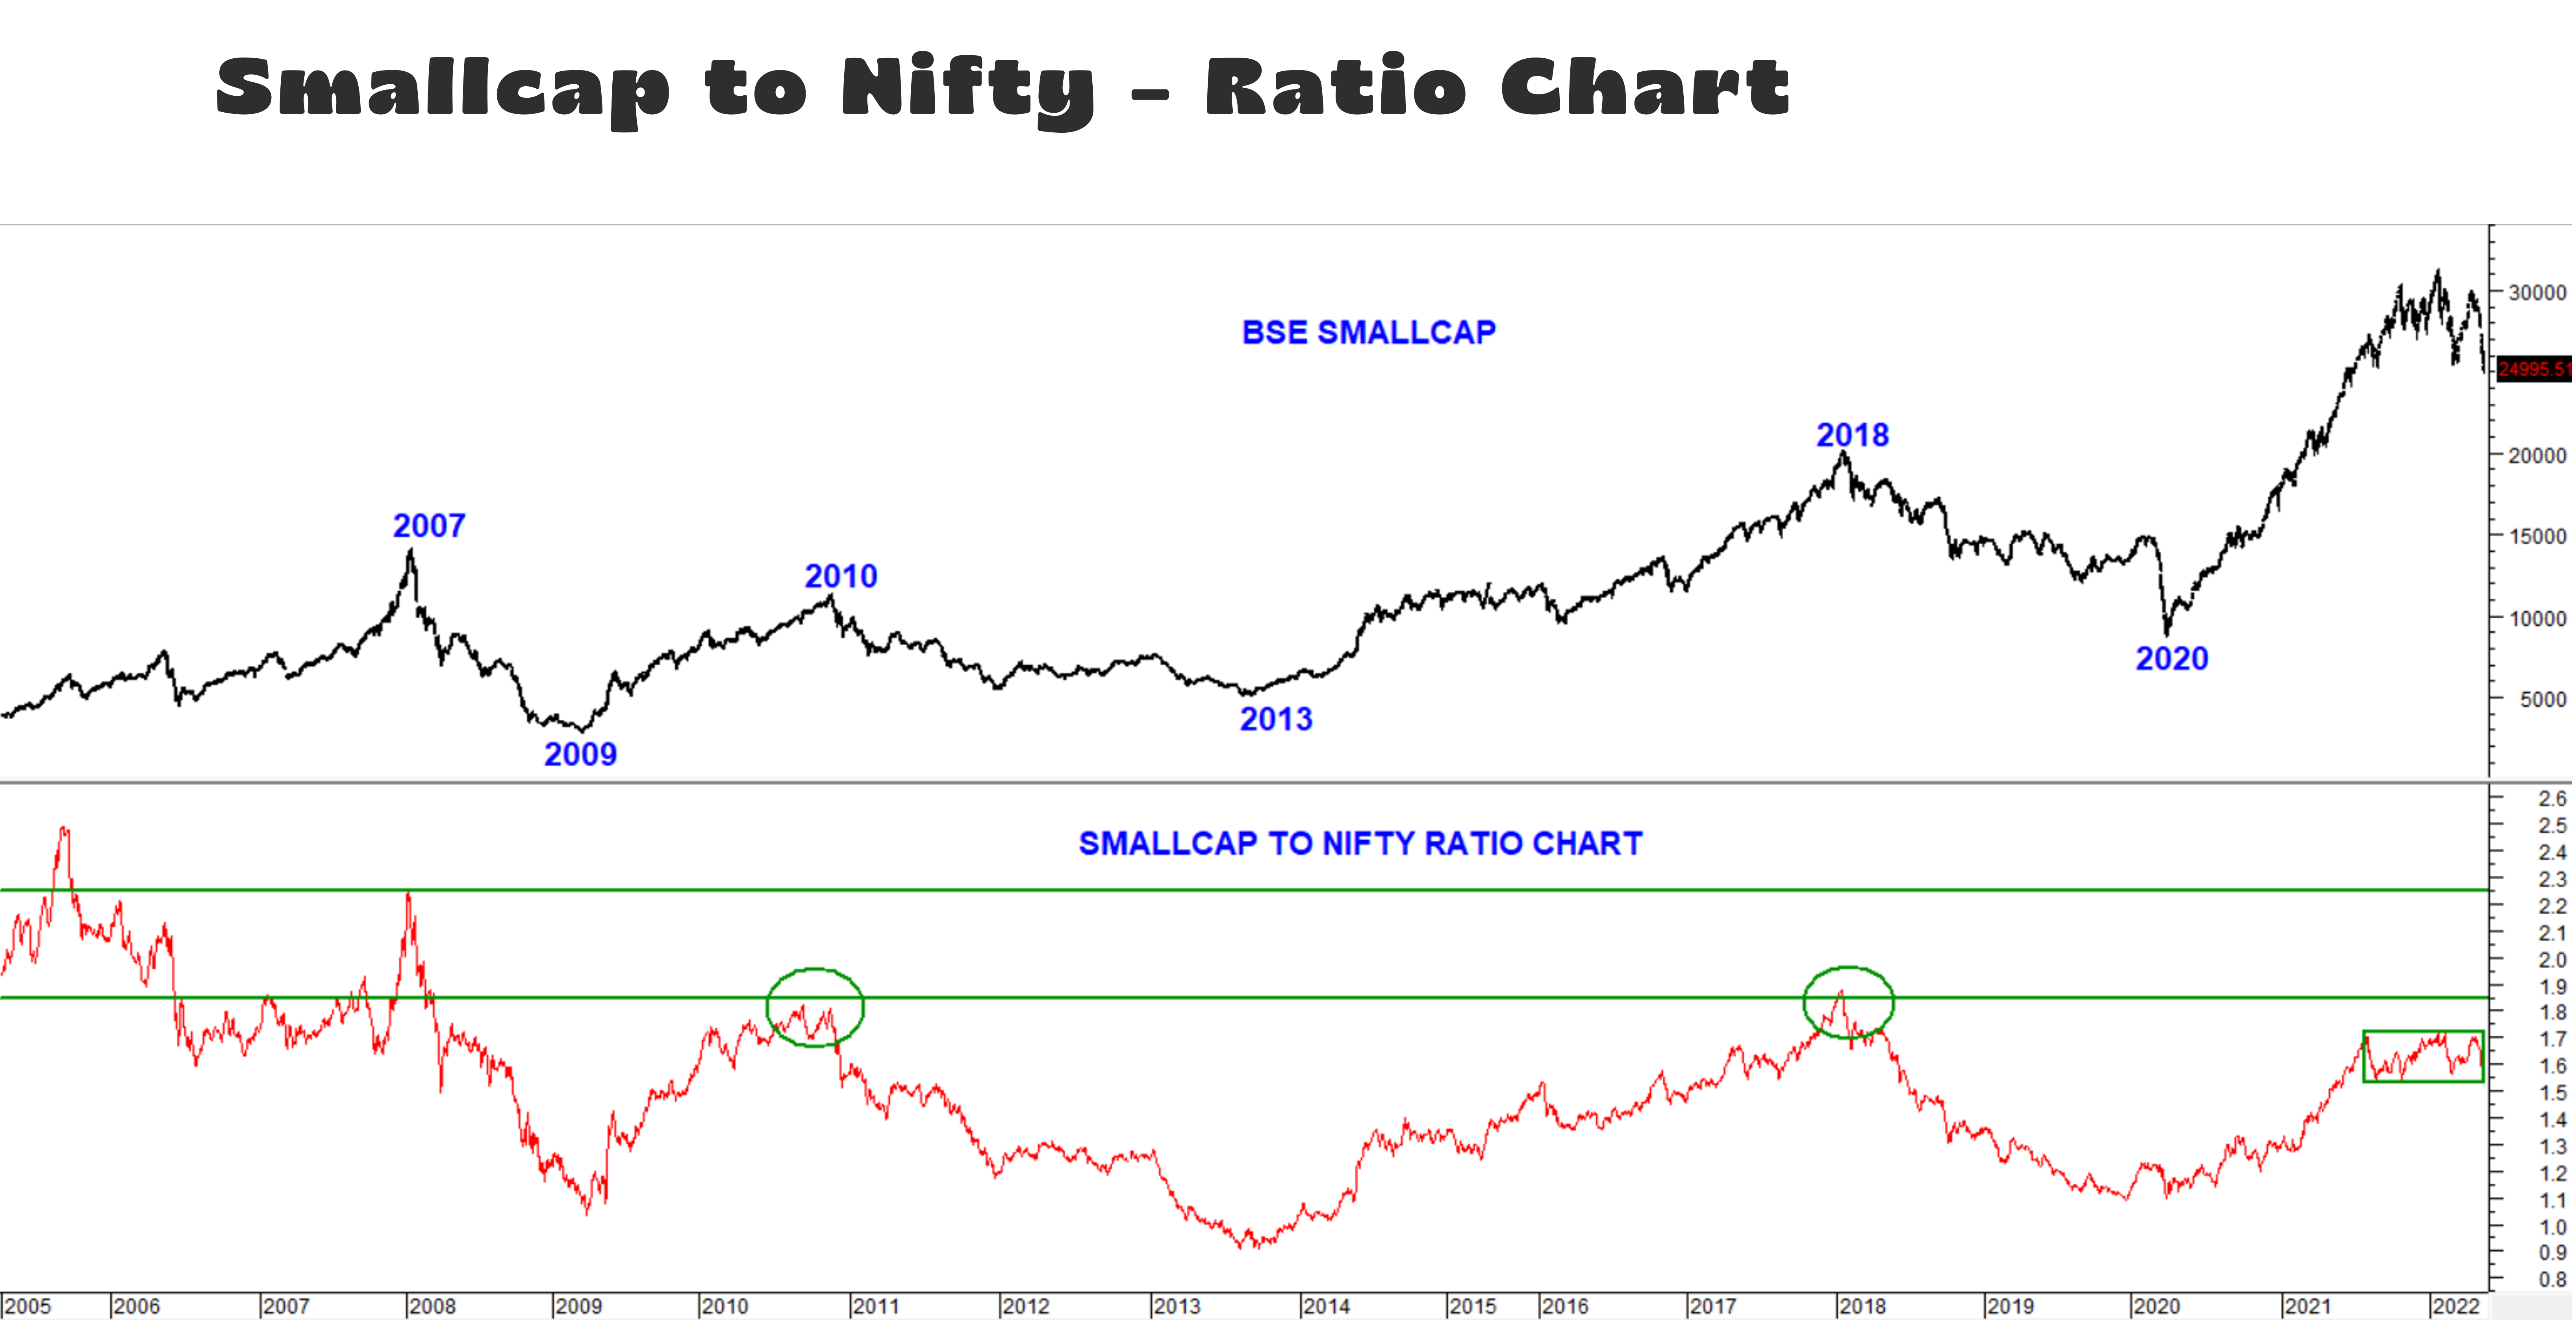
Smallcap to Nifty Ratio Chart - Where do we stand?
- In 2010 and 2018 the Smallcap to Nifty ratio chart touched 1.85 zones before smallcaps topped out
- In 2007 the ratio touched 2.2-2.3 zones
- Currently we are in a range from 1.5 to 1.7 zones
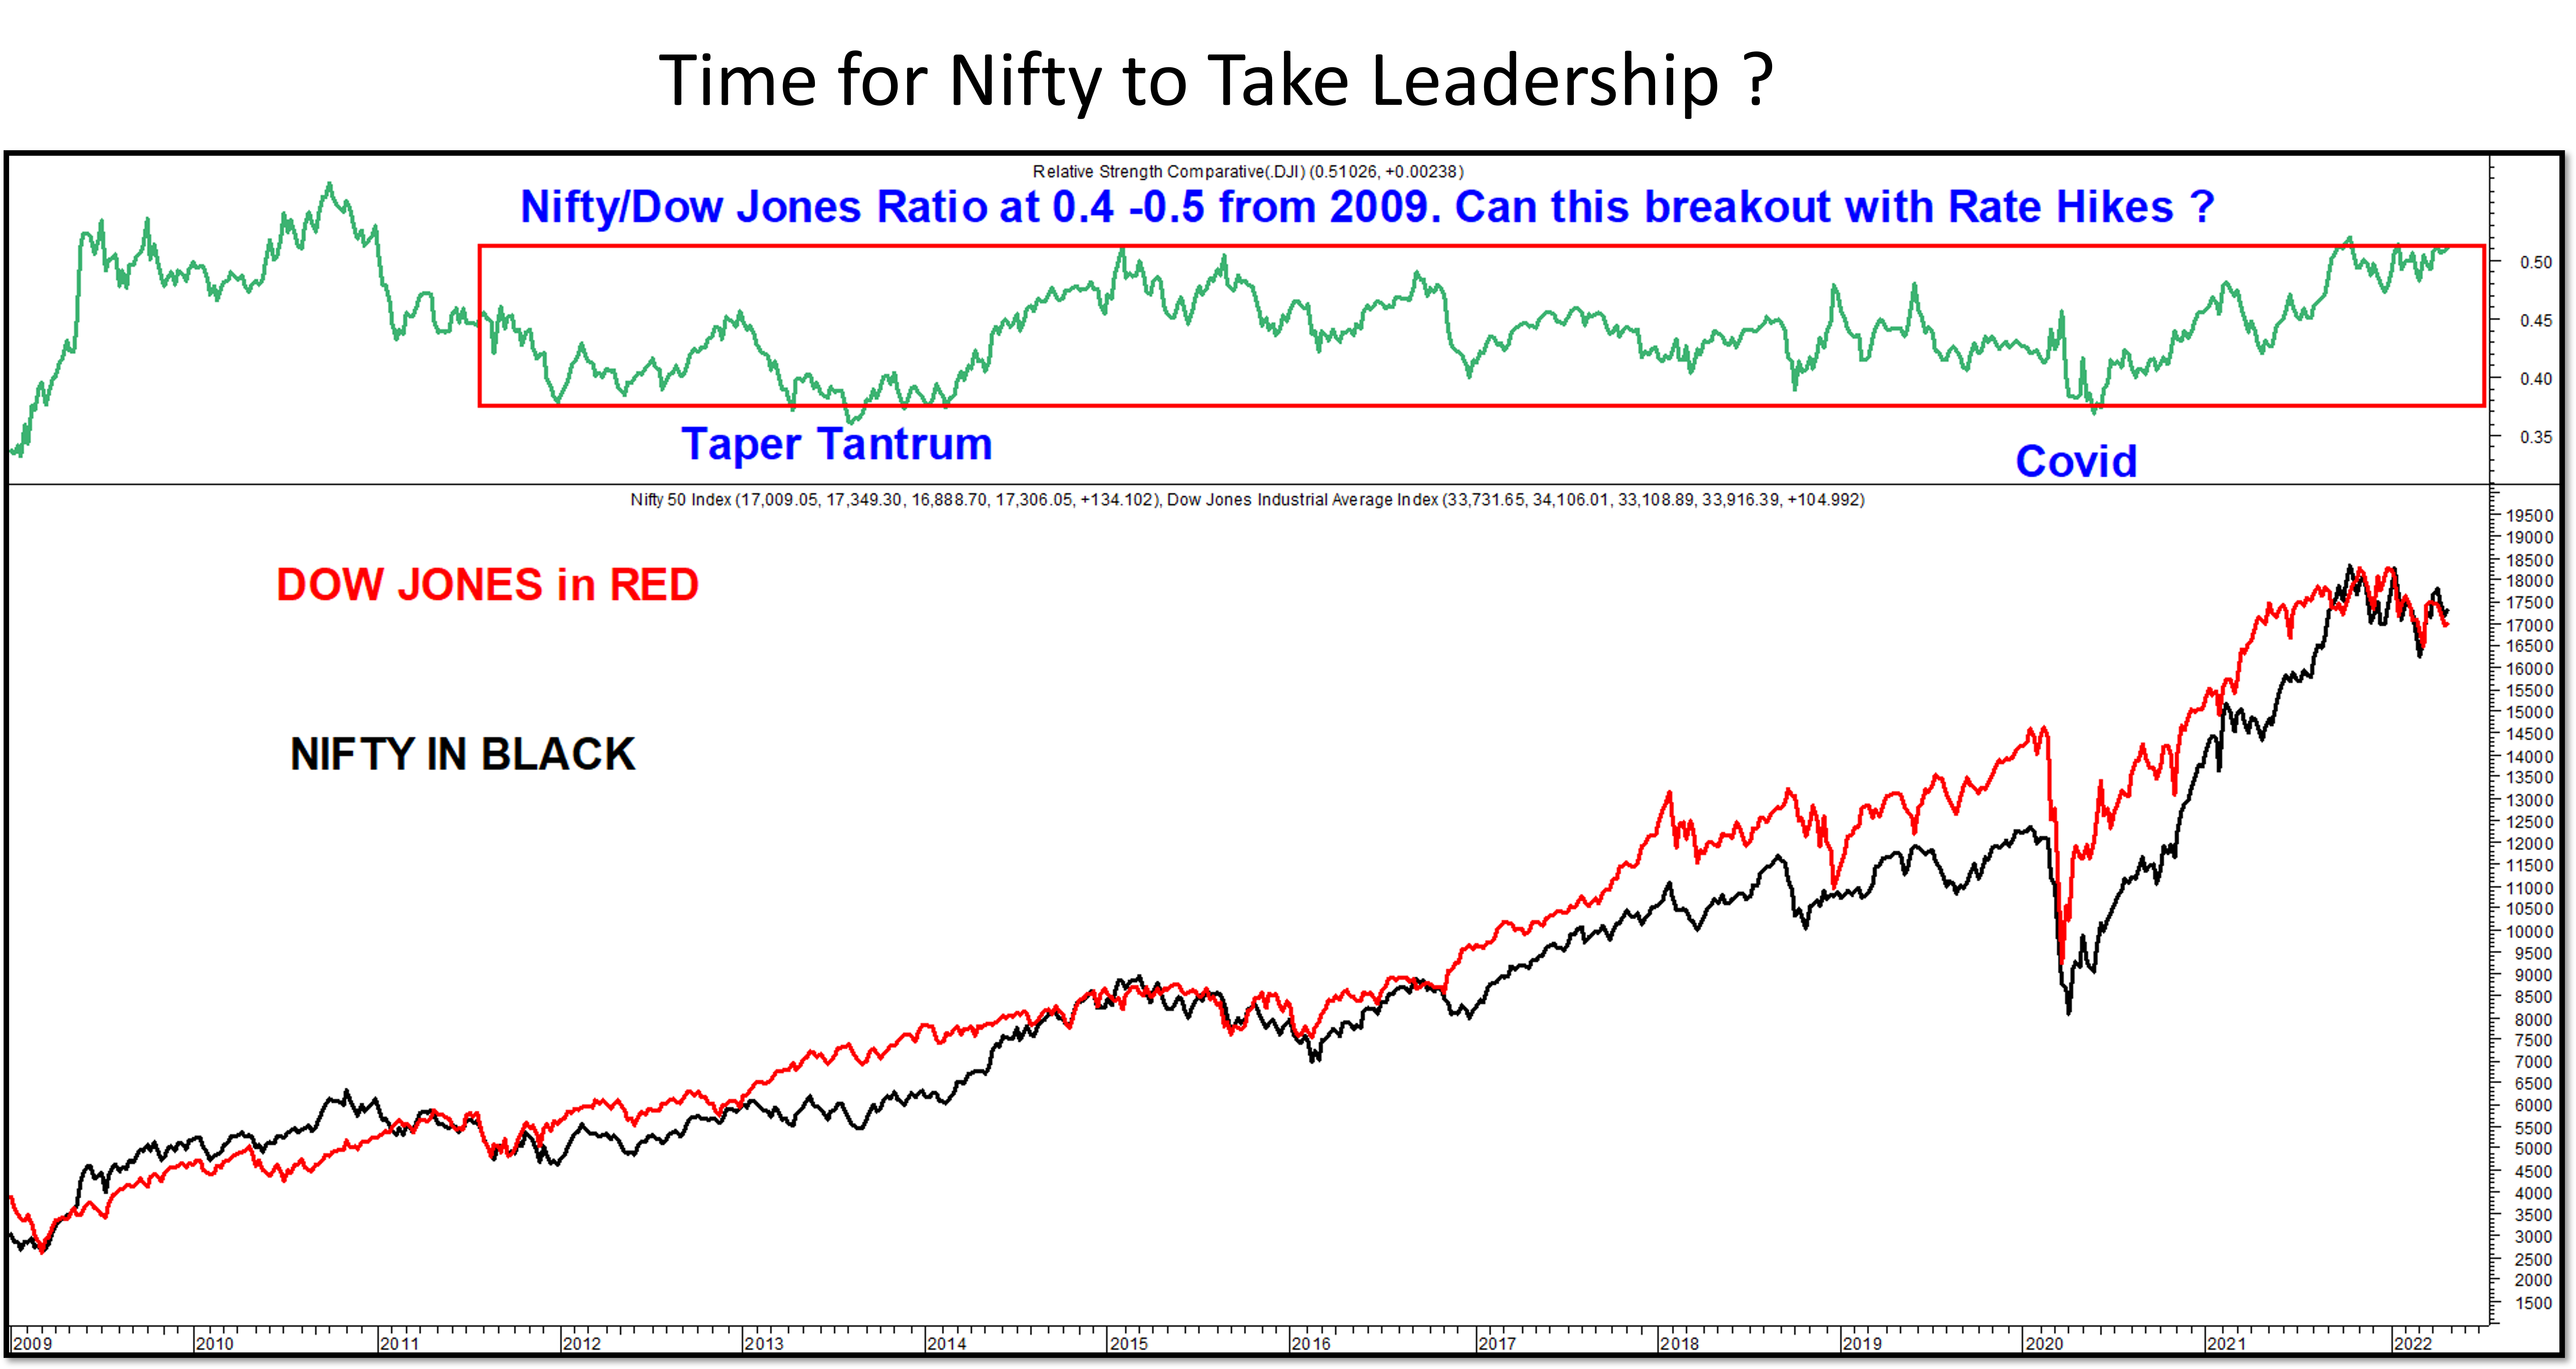
Nifty to Dow Jones - Ratio Chart - Where do we stand ?
- Nifty to Dow ratio stands at 0.4 -0.5 from 2009
- Can this ratio chart breakout?
- Will Nifty outperform Dow Jones?
Rate Hike Cycle
Everyone fears the rate hike cycle. Let us see with data whether the actual rate hikes has led to any market fall in history?
Nifty w.r.t RBI historical rate hikes
- 2006-2007 - Markets rise with Rate hikes
- 2008 - Market falls with Rate hikes
- 2010 -2011 - Market sideways with Rate hikes
- 2013-2014 - Start of a big rally with Rate hikes
Will this be like 2005-2007 or 2013-2014 or a painful period like 2010-2011. But the chart tells us a rate hike is better than rate cut.

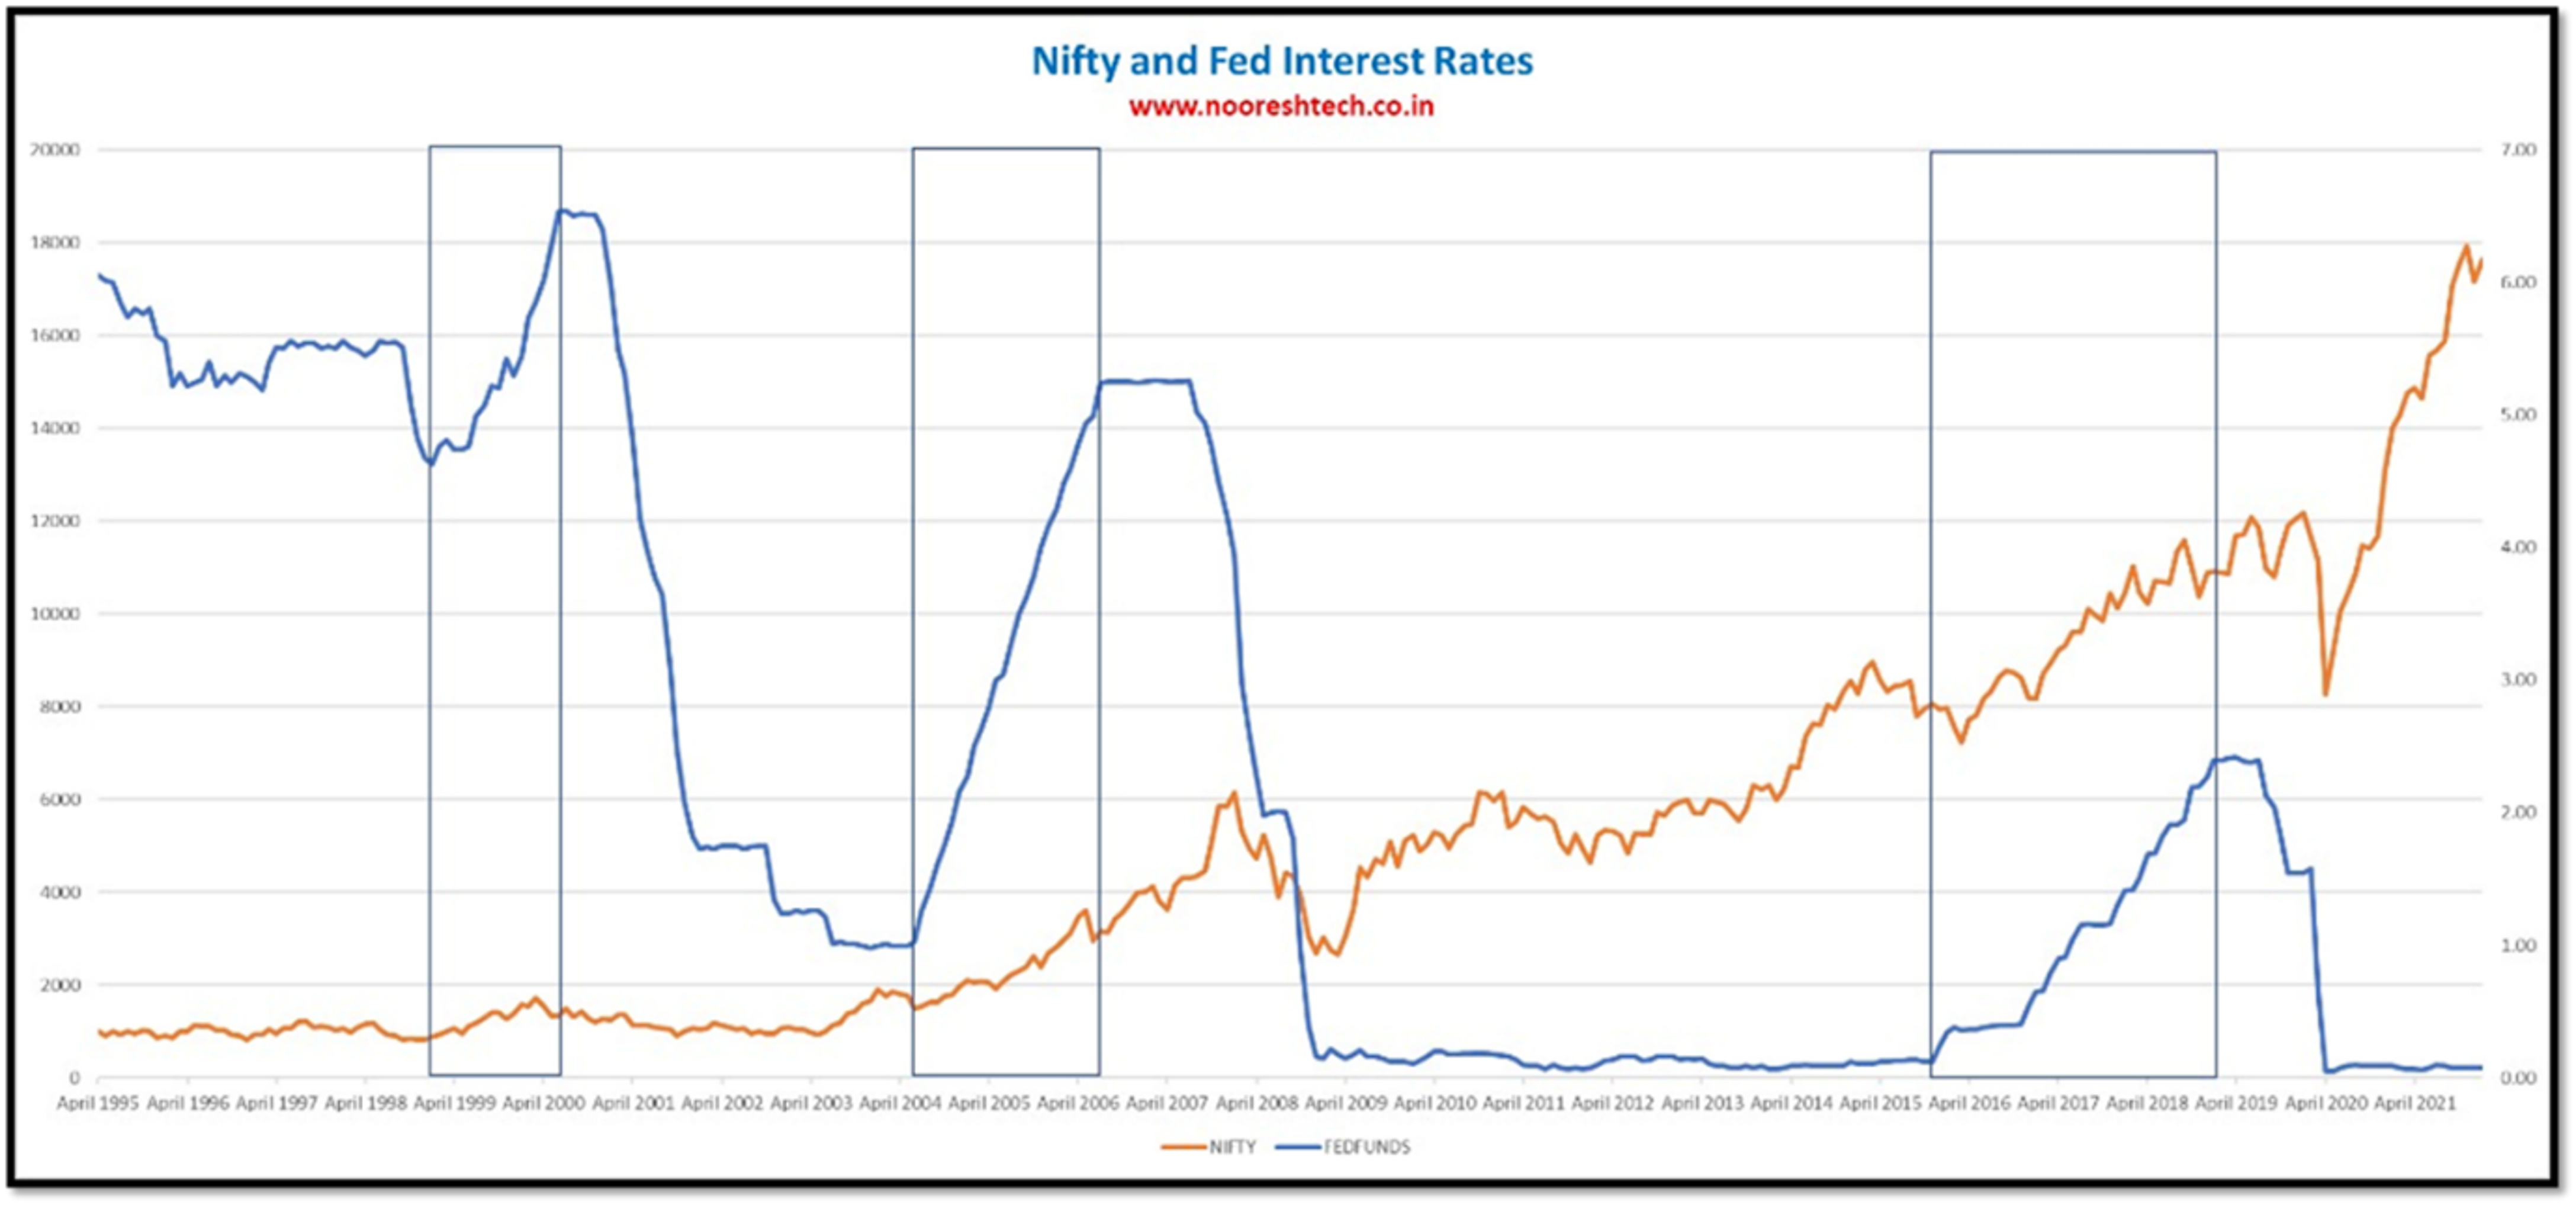
Nifty wrt FED historical rate hikes
- Everytime the US FED has increase rates, our markets have done well in the same period!!
Nifty P/E Ratio
- Nifty Trailing P/E at 19.87. Median P/E at 20.50
- FY22 Expected EPS of Rs.740-760,
- Nifty EPS for FY23 and FY24 is expected to grow at 15% and 10% respectively.
- Based on reasonable 15% earnings growth and trailing PE of 22, Nifty target comes at 18722 for next 12 months and 20570 for next 24 months

Source : https://nifty-pe-ratio.com/
Conclusion
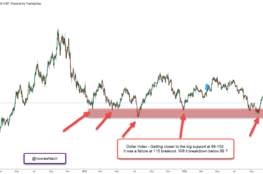
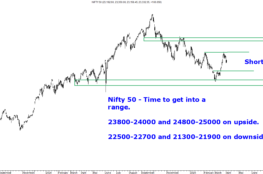
- Technically there are two scenarios I would be looking out for and in both the scenarios a bounce from 15500-15800 band before a clear trend emerges.
Scenario 1
- After an initial bounce towards 16800 or higher followed by consolidation between the recent lows and 17400.
- After that, it forms a Convergence ( as explained in recent webinar ) and a clear trend breakout towards the upside and resumption of an uptrend.
Scenario 2
- After an initial bounce towards 16800 or higher followed by a slow drifting correction similar to either 2011 or 2015.
- India took a much longer time to start a fresh uptrend post the 2011 downtrend due to the after-effects of the excesses of 2004-2007. The Global Markets did not see a similar correction in the 2013 fall ( taper tantrum. USD INR went to 68 then ). So we could expect a similar 25% correction from peak and recovery like it happened in 2011 globally
- Or it could be like 2015 where Nifty corrected 25% from peak with a slow drift with a lot of stock specific and sector specific moves. This has been our favored view for some time now. Like this chart posted below a few months back

- In both the cases, one now needs to be on accumulate mode on declines and not be aggressive till the time the consolidation does not get over and a fresh breakout.
- Stock Specific/Sector Specific opportunities will keep coming. For example post-Russia-Ukraine conflict we could participate in Fertilizers, and Defence Trades which took our Technical Traders Club to a new high, and coz of that can digest the current drawdown.
- We have already spent a good amount of time around 6-8 months in this sideways correction post topping out in Oct 2021. The corrections of 2011 and 2015 were around 12-14 months. I am not in the camp of another event like 2008 or 2020 where Indices fall 40% or more.
- A few triggers which can lead to rejection of scenario 2 are a Resolution of the Russia-Ukraine conflict, Fed Policy tightening, etc. There are more chances of positive triggers as most negatives are known. With this backdrop, a breakout above the sloping trendline say at 17700-18100 would confirm the rejection of scenario 2.
- Simply put time to maintain your investment views and positions. Look to add slowly on declines or be ready to jump in when there is an upside breakout in the near future.
- For a trader it's a time to reduce position size and be on a hunt for opportunities than to fight everyday.