A quick take on the technical structure of Nifty and Bank Nifty.
Nifty50 – Negative Divergences but still above Supports.
- First indications of Divergences on indicators like RSI.
- Last two couple of lows around the 15550-15600.
- Last high of 15430 and breakout zone of 15300.
- Finally momentum seems to be losing steam. Only below 15550-15600 does the momentum shift.
- Above 15900 we are back up.

Bank Nifty – Not able to show strength.
- After breaking out above the 34000-34500 the Bank Nifty did push up but not enough strength.
- The Bank Nifty is back to where it started a month back.
- 34000-34300 remains the crucial support.
- Below 34000-34300 the momentum shifts to down. Above 35500 we are back up.
- So time to wait and watch.

Nifty IT – Taking the Lead.
- After being a leader in the initial recovery the Index took a breather for last few months.
- Now after making a new all time high and also holding on to positive territory in last few days of Nifty struggle shows relative strength.

Nifty50 Equal Weight
- This has become an important chart to look out for given the extreme concentration in the Nifty.
- For the last couple of months the relative strength of Nifty50 Equal Weight to Nifty gave the conviction to ride the moves across broader markets and avoid the Nifty heavyweights.
- For now the one way strength seems to be taking a pause.

Research Analyst Services.
LinkTree - Links to all our services and products - https://linktr.ee/NooreshTech ( Do checkout ) or on the website nooreshtech.co.in
Free Technical Analysis Ebook ( if you have not read yet.) – Analysis that Works
Online Technical Analysis Training Video Course – 1 year Access.
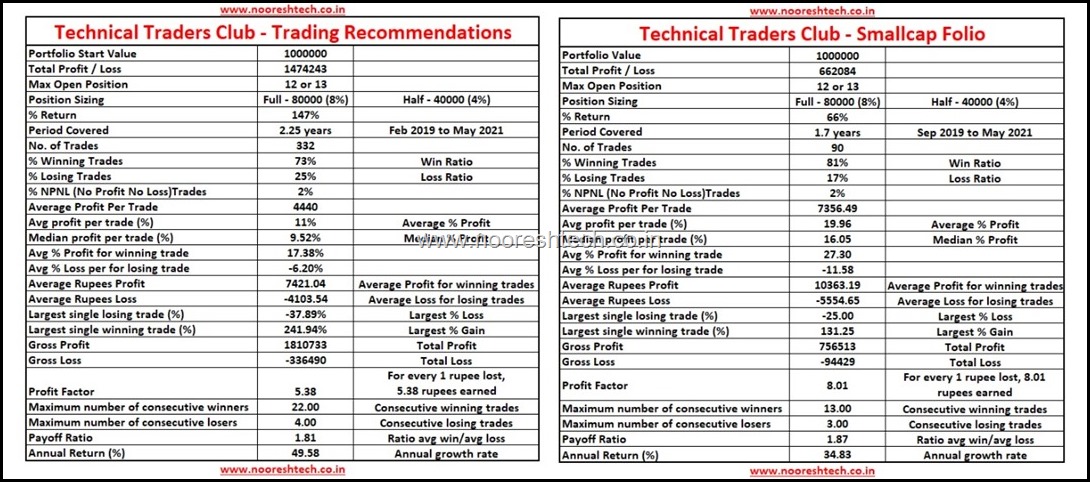
Technical Traders Club Performance
Technical Traders Club - https://nooreshtech.co.in/quickgains-premium/technical-traders-club