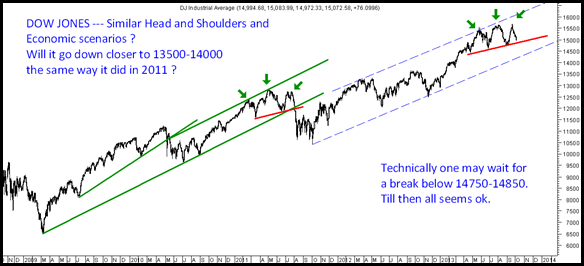
Its been quite some time since i have looked into Dow Jones and before writing this post did look into some blogs and mails to get a sentiment av
Now what is interesting is the above chart looks pretty similar to 2011.
In 2011
- > End of QE 2
-> Uncerainty around Debt Limit Negotiations
-> S&P downgrade.
Now in 2013
-> Fed Tapering
-> Govt Shutdown
-> Debt Limit
Now the technical similarity
-> A good strong upmove from lows after consolidation
- > Took 3-6 months to form the Head and Shoulders formation.
-> Almost a similar size of head and shoulders. ( little lesser target in 2013)
Although this is a presumption that a similar pattern will unfold but a break below 14750-14850 will confirm the possibility of a downside.
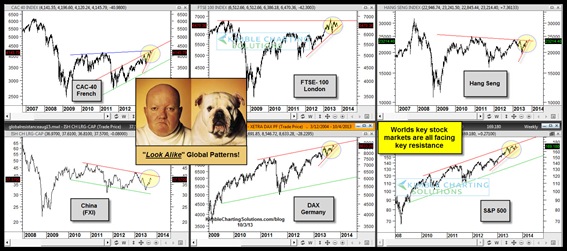
This for now is an interesting similarity but will keep watch on a similar breakdown if happens will need to act accordingly as a such correction in US markets will keep other markets also under pressure or maybe lead to a global correction.
This is another chart from Chris Kimble. Link to the post and the chart below.
Bottomline : Although there is no confirmation of a breakdown but one needs to be alert for acting on shorts as and when the price ticks below important support levels. Better to be cautious than brave at this time.
TECHNICAL ANALYSIS TRAINING SESSIONS
Planning for a training program in Chennai on October 26-27.
People interested can mail to analyseindia@analyseindia.com
Mumbai session planned for October 2nd weekend.
Also we will soon be coming out with a online training program which will be through 2 weeks and in small 2-3 hour sessions. For now the material is being prepared and other execution issues being solved.
Regards,
Nooresh


