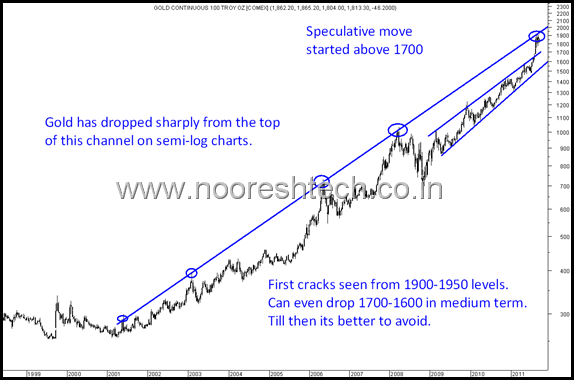
If we look into the long term charts of gold on log scale. ( Log scale takes into calculation percentage based moves and not absolute so gives a better picture for long term trends.)
We have tested the top of the long term channel at 1900-1950. Every time Gold has touched the higher end of the channel it has ended up correcting 15-20% also over the next few months. ( Also its
Although there would be many arguments of Gold being a good hedge to inflation or a great long term story but at current levels one may pause a bit on Gold Buying and if you have not bought gold yet its better not to take exposure to it.
This is purely from a market perspective and from current levels i would at least expect the pace of gold rise will slow down and downside risks seems more higher.
If one has to enter i believe a technical entry point comes around 1600-1700 dollars.
This is just a technical view 🙂 rest everyone may have their own strategy on gold.
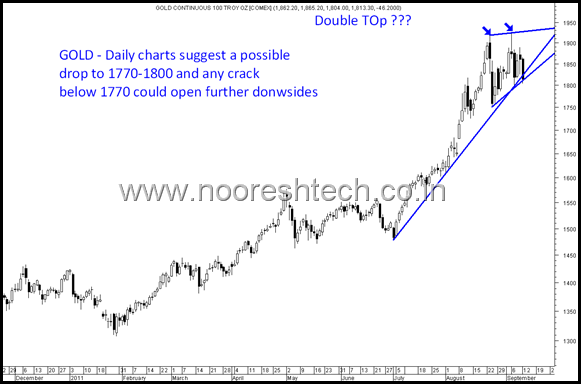
For the traders i would suggest to be careful on short term longs. Below 1770 there could be much sharper correction in gold. One may even look for a short at 1880-1920 zone.
Lets have a look at the daily charts which shows 1770 is an important level.
Time to be careful on short term longs on gold or keep a strict stoploss of 1770. If one were to compare Silver also touched 49-50 dollars twice before correcting sharply.
TECHNICAL ANALYSIS TRAINING SESSIONS SCHEDULE
HYDERABAD SEPTEMBER 17-18
BANGALORE SEPTEMBER 24-25
Regards,
Nooresh


September 13, 2011
I agree with your view. The last time this pattern was formed was around 1980. There was a fall after that.
September 15, 2011
Hi Munir,
Yes its all about when it cracks
September 26, 2011
sir , your chart prediction in gold is geniuss .
September 26, 2011
thanks,
hope u made money of it