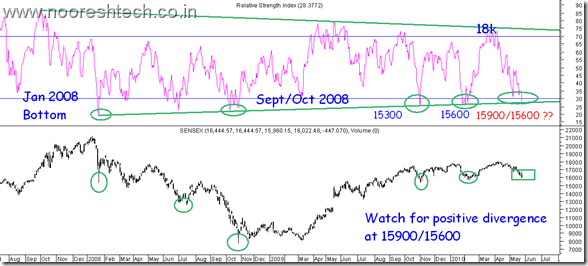
Before i speak upon RSI and positive divergence it would be essential to mention that RSI as an indicator is generally lagging or too early. At this point of time it might be giving an early signal of a strong bottom being formed for the short term.
Before we look into the chart let us look into the previous instances of RSI indicator charts discussed in this blog. Check links below for the same.
https://nooreshtech.co.in/2009/11/video-analysis-at-15300-15500-do-check.html
https://nooreshtech.co.in/wp-content/uploads/blogger/1177-RSISensex.png
Click to enlarge picture.
RSI showing highly oversold conditions recently..
Technical Observations:
- -- >The last two times i had used the RSI indicator as an observation was at 15300 and 15600 bottoms but that was 100-300 points before the low was made.
- -- > So ideally we are just 100-30 points from current levels in the worst case and a sharp bounce after that.
-- > In the last two such dips and every time from Jan 2008 the bottoming out has taken 1-8 sessions max
-- > Another thing to note is if we see a positive divergence in coming days. ( If i do see this in next week will post it )
Sensex Technical View:
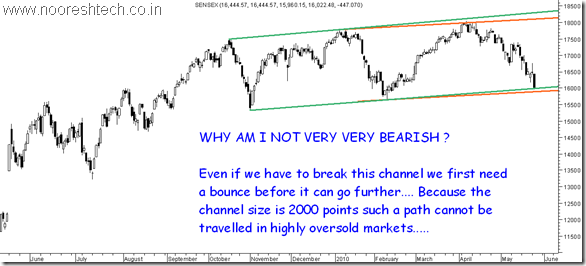
Although global indices have broken down short term levels and another 5% correction is not ruled out but Sensex has almost achieved the possible support level of 15900 which can worse be broken in the day by 100-200 points but i doubt the index can break 15600.
Well yes this is in stark contrast to the highly bearish view by many people. Technical Chart and Reasons below.
Reasons -
Index is highly oversold equivalent to Jan 2008/Oct 2008 and many such panic bottoms.
The alternative supporting a deep correction is a possibility of the channel breakdown.
But in this alternative the target price comes to 2000 points lower once we go below 15600.
In current oversold conditions it would not be logical to expect such a huge drop without a good sharp bounce.
As per normal Open Interest or Fundamental Analysis the Leverage or Open positions in the market is not as huge as Jan 2008 or October 2009 which was aggravated due to Margin Selling. So falls would be gradual with index already corrected 10%.
Conclusion:
Its a crucial situation. Keep a stoploss of 15600 on your longs ( stock portfolio) or 15900 on 2-3 days closing basis. Upsides would open up only on closing above 16800 in near term.
Closely watch the next 1 week with patience for more signals as volatility would be very high. As per time analysis this week is very crucial for bottom formation.
I would review the situation if 15600 breaks ( would be surprised/shocked and scared as i dont expect it) or around June 1st week where one could see the bounce back. If 15600 holds till June 2nd week a pleasant surprise can be expected in July.
Only personal observation for myself was although i was cautious at 18k and 11200 Dow we should have taken a more negative approach:(
Above are my personal views which can be naive and short-sighted so please do your own research.
But yes i would continue to give the view as per my analysis and take the risk of going wrong rather then being diplomatic.


May 25, 2010
Amazing ..Nooresh Bhai..
just excellent…great post!
May 25, 2010
Dear sir,
I am your regular reader of ur blog. So nice analysis of weekly sensex with RSI indicator chart. try to give comment on NIFTY also. Thanks. regards He$H… ( from yahoo messanger)
May 25, 2010
Hi Nooresh,
I have to give it to you to make such a brave effort! in this panic situation by giving those levels boldly.It requires a clear mind to view in this stormy weather.Now we moving in opposite direction after a pause(being flat for sometime).Still it is a trending market no matter it is moving downwards.It did give a bounce as you suggested to 5000 level, those who had heeded your call would have profited handsomely.I also hope 15900-15600 levels hold and a bottom is found around those levels.I do believe in India story and your analysis makes it a worthy call.
May 26, 2010
keep it up sir xcllnt wrk