There have been a lot of targets for Nifty across the board. Some will talk about 5000-7500 and some bullish will be at 1000-12000.
In our last post we looked at how Broader Markets are very close to the pain as it had seen in 2008.
Nifty Calculator – Download from this link – Nifty Calculator
What is Nifty Calculator ?
-> As per the weightages given by NSE for Nifty stocks we have created the Nifty Calculator.
-> Change the expected price and the expected Nifty will change accordingly
-> Create 3 different sheets for yourself–
Pessimistic ( where you put the worst possible prices you think . Default 15% down )
Optimistic ( the best prices possible. Default 15% up)
Neutral/Rational/Technical / Fundamental ( prices on any reasoning )
Please Note as weightages change every day by small margin this will not give an accurate estimate but will be approximate.
How to Guess?
- Everyone has a view on Nifty based on Macro, PE, Valuations, Technicals, Waves etc. Try to grill it down to the constituents. It should be a reflection of your actual guesstimate.
- Just estimating wild scenarios on the top 20 stocks is enough given the 80% weight.
- Start with changing default fall to 5-10-15-20-40-80 or rise to 5-10-20-40-80.
- Then change stocks which you think may not do the default move.
- Do send me the Excel Sheet if you get beyond 5000 or 12000 !! ( Mail me on nooreshtech@analyseindia.com or 9819225396 )
Interesting Observations
- Top 20 Stocks are 80.34% of the Index. Highest Ever.
- Top 10 Stocks are 62.5% of the Index. Highest Ever.
- After a long time top 2 stocks command 20% or more weight in the Index.
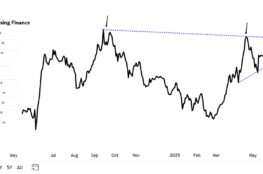
- Banking and Financials have seen weight drop from a peak of 40.39% to 36.5%.
- HDFC and HDFC Bank have a weight of 18.3%
- Last 20 of Nifty have a weight of only 10%. Equivalent to a HDFC Bank or Reliance.
| Mar-20 | Oct-19 | Sep-19 | Aug-19 | Jul-19 | Jun-19 | May-19 | Apr-19 | Mar-19 | |
| Sector | Weight(%) | Weight(%) | Weight(%) | Weight(%) | Weight(%) | Weight(%) | Weight(%) | Weight(%) | Weight(%) |
| FINANCIAL SERVICES | 36.51 | 39.48 | 39.29 | 39.48 | 40.25 | 40.39 | 39.87 | 37.95 | 38.85 |
| IT | 15.04 | 13.01 | 13.88 | 15.36 | 14.8 | 13.71 | 13.76 | 14.46 | 13.66 |
| CONSUMER GOODS | 14.46 | 12.39 | 12.35 | 11.04 | 11 | 10.66 | 10.74 | 11.24 | 11.3 |
| OIL & GAS | 12.45 | 15.3 | 14.74 | 14.42 | 13.97 | 14.37 | 14.74 | 15.31 | 15.3 |
| AUTOMOBILE | 4.54 | 6.11 | 5.52 | 5.42 | 5.16 | 5.71 | 5.94 | 6.11 | 6.09 |
| TELECOM | 3.13 | 1.78 | 1.94 | 1.94 | 1.87 | 1.84 | 1.71 | 1.62 | 1.51 |
| CONSTRUCTION | 2.79 | 3.72 | 3.86 | 3.65 | 3.78 | 3.99 | 4 | 3.51 | 3.66 |
| PHARMA | 2.72 | 2.15 | 2.07 | 2.33 | 2.31 | 2.15 | 2.21 | 2.43 | 2.42 |
| METALS | 2.52 | 2.93 | 3.03 | 2.96 | 3.29 | 3.6 | 3.43 | 3.72 | 3.69 |
| CEMENT & CEMENT PRODUCTS | 2.22 | 1.5 | 1.57 | 1.56 | 1.69 | 1.74 | 1.76 | 1.77 | 1.61 |
| SERVICES | 0.54 | 0.64 | 0.69 | 0.64 | 0.66 | 0.67 | 0.68 | 0.65 | 0.64 |
| FERTILISERS & PESTICIDES | 0.5 | 0.67 | 0.7 | 0.69 | 0.72 | 0.72 | 0.76 | 0.75 | 0.75 |
| MEDIA & ENTERTAINMENT | 0.32 | 0.33 | 0.35 | 0.49 | 0.48 | 0.42 | 0.41 | 0.51 | 0.53 |
Did a Small Chat with ET Markets - India lockdown: This Mumbai investor is doing exactly what he did in 2008

April 3, 2020
PL MAIL CHARGES FOR SUBSCRIPTION.
April 3, 2020
મેં ફિબોનાચી ચાર્ટ ઉપર ચેક કરતા લેવલ 7515 નું આવે છે જે એક વખત ટેસ્ટ થઈ ગયું છે. અને ફરી વાર પણ ટેસ્ટ થઈ શકે છે. હજી મંથલી 200 EMA 6830 Touch નથી કરી.BUT Midium to Long Term Trend -ve છે. જેથી 6800 નું લેવલ આવી શકે છે
April 4, 2020
approx 80%+60%+20%…how come it is more than 100%weightage???
April 4, 2020
Please re-read what you have written.