This might be the first article on which are the technical analysis softwares or the tools for technical analysis. Most of these discussions are only part of our technical analysis training programs.
Before we start this one needs to realize the importance of having a basic knowledge of technical analysis , as without the softwares may not be of any use.
There was a time decades back when charts were drawn on paper and slowly we started getting a lot of softwares. Today one of the better business is to sell Technical Analysis Softwares then to use it.
So in this attempt to avoid people from buying useless and expensive technical analysis softwares we will focus on the best free ones. ( Softwares/ Automated Signals etc dont make money for you , if they would then why would they sell it. )
Will try to write quick posts on some of them as and when possible.
Gannalyst Professional 5.0
The software is designed for gann analysis which I dont have much of an idea 🙂 Although read quite a lot in initial days of technical analysis.
Even though the software has been made for gann analysis it has all the tools for classical technical analysis.
The most important feature is the software is compatible with most of the data formats like metastock, ascii, csv etc.
It does not provide inbuilt data like many other softwares but one can use this in offline mode unlike the other softwares.
Lets look at the steps on getting started with this.
1) Installation.
You can download the file from this link - https://gannalyst-professional.software.informer.com/download/ . Its barely 6-7 mbs.
( the original website is shut )
Also can go through this tutorial made by gannalyst team -
2) Data
You will need to subscribe for end of day data from any of the vendors. The end of day data for all indian stocks, global indices, commodites is available at a cost of Rs 3000 to Rs 5000 annually from various vendors. Can connect with Harsh 9833845334 for details.
3) Software Usage.
In this case I'm just putting up a few screenshots to explain how to use the software
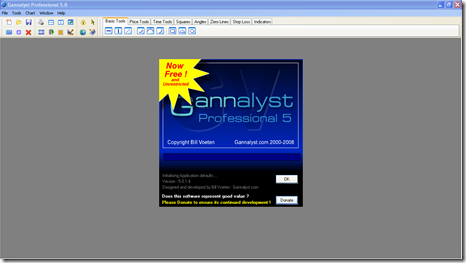
Home Screen
On opening the software it gives you an option to donate or just go ahead. If you do like it donate 🙂
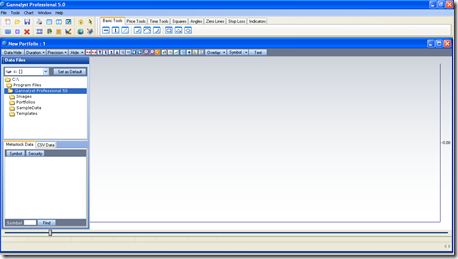
Portfolio or Folder Opening
-> Go to File New Portfolio
-> Browse through for your data folder.
-> In this example I have browsed through to my Nifty 50 folder and clicked on Sun Pharma.
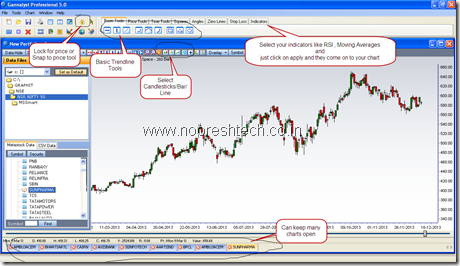
-> You just need to click on line/candlestick/bars to decide the way you want to see it.
-> Click on indicators pane , select your indicator and just click on apply and its there on the screen.
The screenshot below will help you understand some of the utilities.
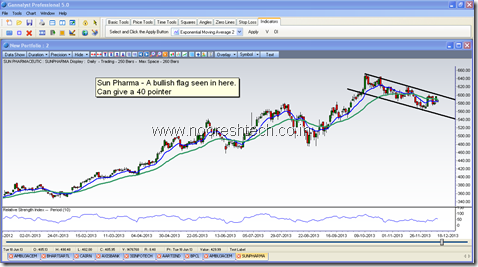
Another screenshot
The software has all the basic tools you need like trendlines, indicators, time tools, retracements, adding text, saving as an image and most of the basics. Would recommend testing the above software.
If you are looking out for back testing , filters and automated tools ( i am not a fan ) than this software does not have it. But if you are looking out for a clean, simple, easy to load and install plain technical analysis tool then this is a good one.
Authors Tip
-> One of the best features is the time and percentage tools it helps you find the % ge moves in peaks/troughs and even the time taken.
-> Save your portfolios and also templates and create defaults in this software and after some days of use this would be a good one.
In our next segment we may look into another interesting software – Chart Nexus and online websites like icharts.in , chartink.com and so on.
Readers can also put in their suggestions and if you would like to write a detailed article on a particular software do mail me on nooreshtech@analyseindia.com
Online Training
Online Technical Analysis Course @ 999/- (1 year access)
Please note: We have reduced the course pricing from ₹6000 to ₹999 as it was recorded in 2020. However, rest assured, the content remains highly relevant and valuable.
Course Content:
- Introduction to Technical Analysis
- Candlesticks Patterns
- Technical Analysis Concepts
- Indicators that work
- Chart Patterns
- Price and Volumes
- Sectoral Analysis
- Cyclical Investing
- Softwares and Utilities
- Trading Psychology
Small Video explaining the content - https://youtu.be/fJYX1TP0a6I
Detailed Curriculum and Subscribe:
Can buy the course from this link and go through the entire curriculum
https://bvuod.courses.store/149782
Please note : Org Code for login is BVUOD
Or you can download our app - https://gbolton.page.link/Ng1y
Thanks and Regards,
Nooresh Merani
Twitter – https://twitter.com/nooreshtech
Facebook – https://www.facebook.com/nooreshtech


December 11, 2013
Sir,
I use this S/W. It is really a nice S/W for analysis.
Anandha
August 3, 2020
If you use Gannalyst help me to setup the same.
August 3, 2020
whatsapp 9404638220
December 12, 2013
thank you sir for providing details for this software.
this is seriously a nice step….
September 27, 2014
how can we use amibroker data with this software